In my last post, I commented on the strong breakouts in metals out of bull wedge consolidations. These breakouts were ultimately short-lived and quickly reversed on vaccine news, washing out swing longs and once again pushing price lower to another test of falling resistance. The thesis from that post remains intact – metals continue to remain in strong uptrends with price likely to push to higher highs – but in the near term price continues to digest supply and needs more time.
GOLD
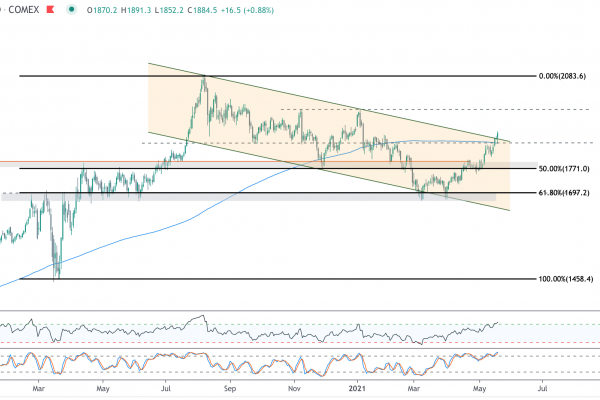
Gold has a confluence of support coming in at 1832, 1828, and 1822. Below there, 1790 lingers as the key breakout level from the 7-year base. With stochastics oversold, the downside on this selloff looks limited. For those with a longer time horizon, the area between 1790-1830 is a strong area of support.

SILVER
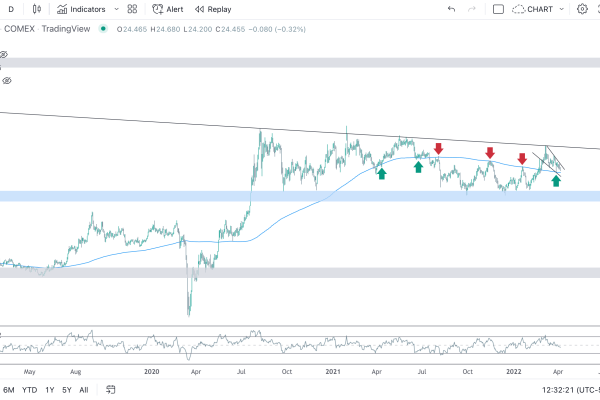
In Silver, I am watching 23.08 (retest of 161.8 Fibonacci extension) and 22.57 (the anchored VWAP from March low) as important levels. Like gold, silver is getting a little oversold on stochastics and I think the 22.57-23.08 is very likely to hold.

10-Yr NOTES
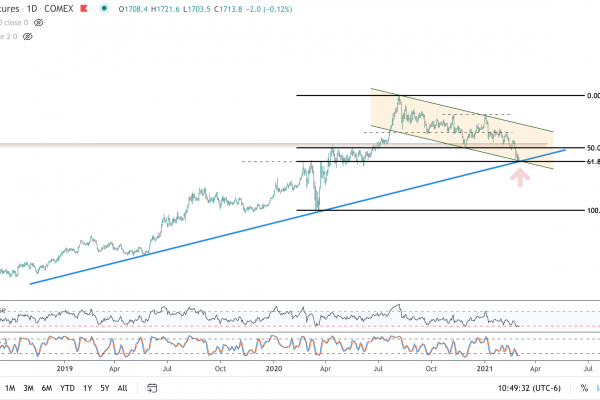
Gold has been highly correlated to 10-year notes, which have also been consolidating and are now coming into rising support from the October 2018 low. Long consolidations like this within strong uptrends are much more likely to resolve in the direction of the underlying trend, and if 10-year notes rally off support, we can expect gold to be not far behind.

As always, I would love to hear your feedback. And Happy Fibonacci Day: 11-23!
Today is November 6th, we still do not have a President-elect, and the legal fight over ballots and vote-counting seems destined to drag on for weeks, if not months. For those investors determined to allocate capital based upon the election outcome, the uncertainty can be paralyzing. We can expect a likelihood of a split government, but there is no certainty beyond that. My solution is to follow price.
In my last piece, I noted that precious metals were trending up, and the US Dollar was trending down. Yesterday’s price action confirmed that, following a multi-week consolidation period, these trends have resumed.
Big Gold Breakout
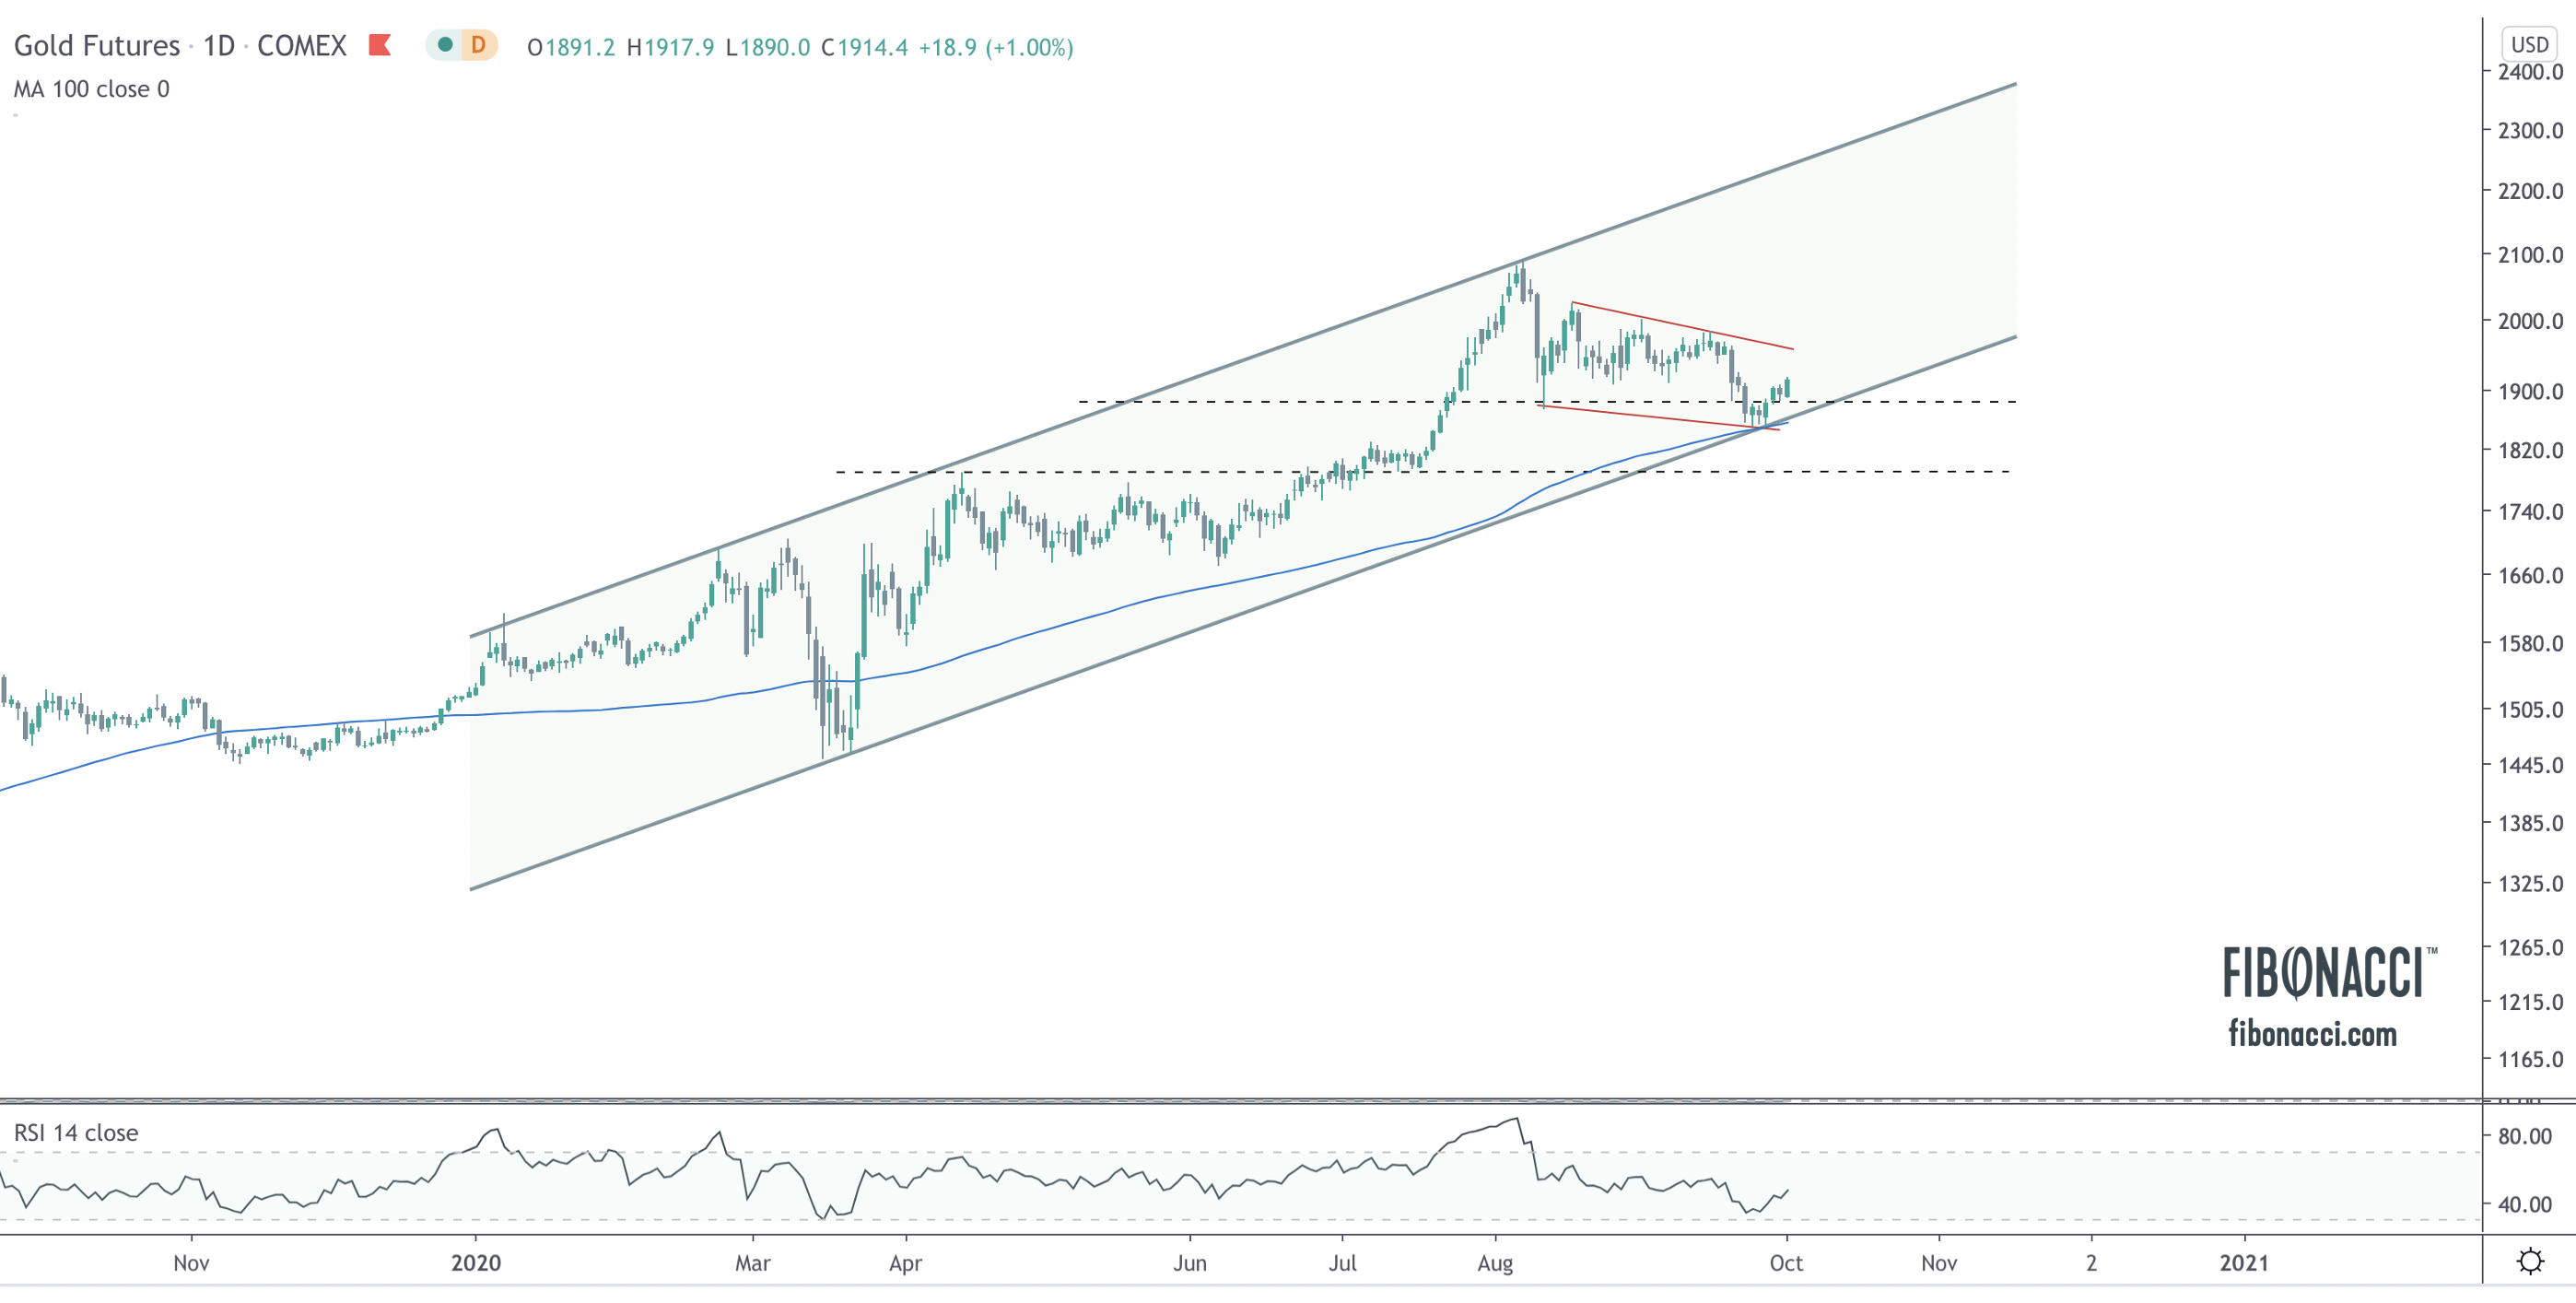
Using the March peak/trough in gold has been a reliable Fibonacci measure for extension levels. The pullback from the August high was nothing more than a rejection at the 261.8 Fibonacci extension and a retest of the breakout at the 161.8 extension. Yesterday’s bull wedge breakout on a monster $50 candle, while breaking out above the 50 day moving average, suggests that gold is setting up for another run to 261.8 extension. Note also that after getting extremely overbought at the August peak, gold never hit oversold conditions throughout the entire consolidation period, suggesting that bulls are still in control.

Silver Also Confirming
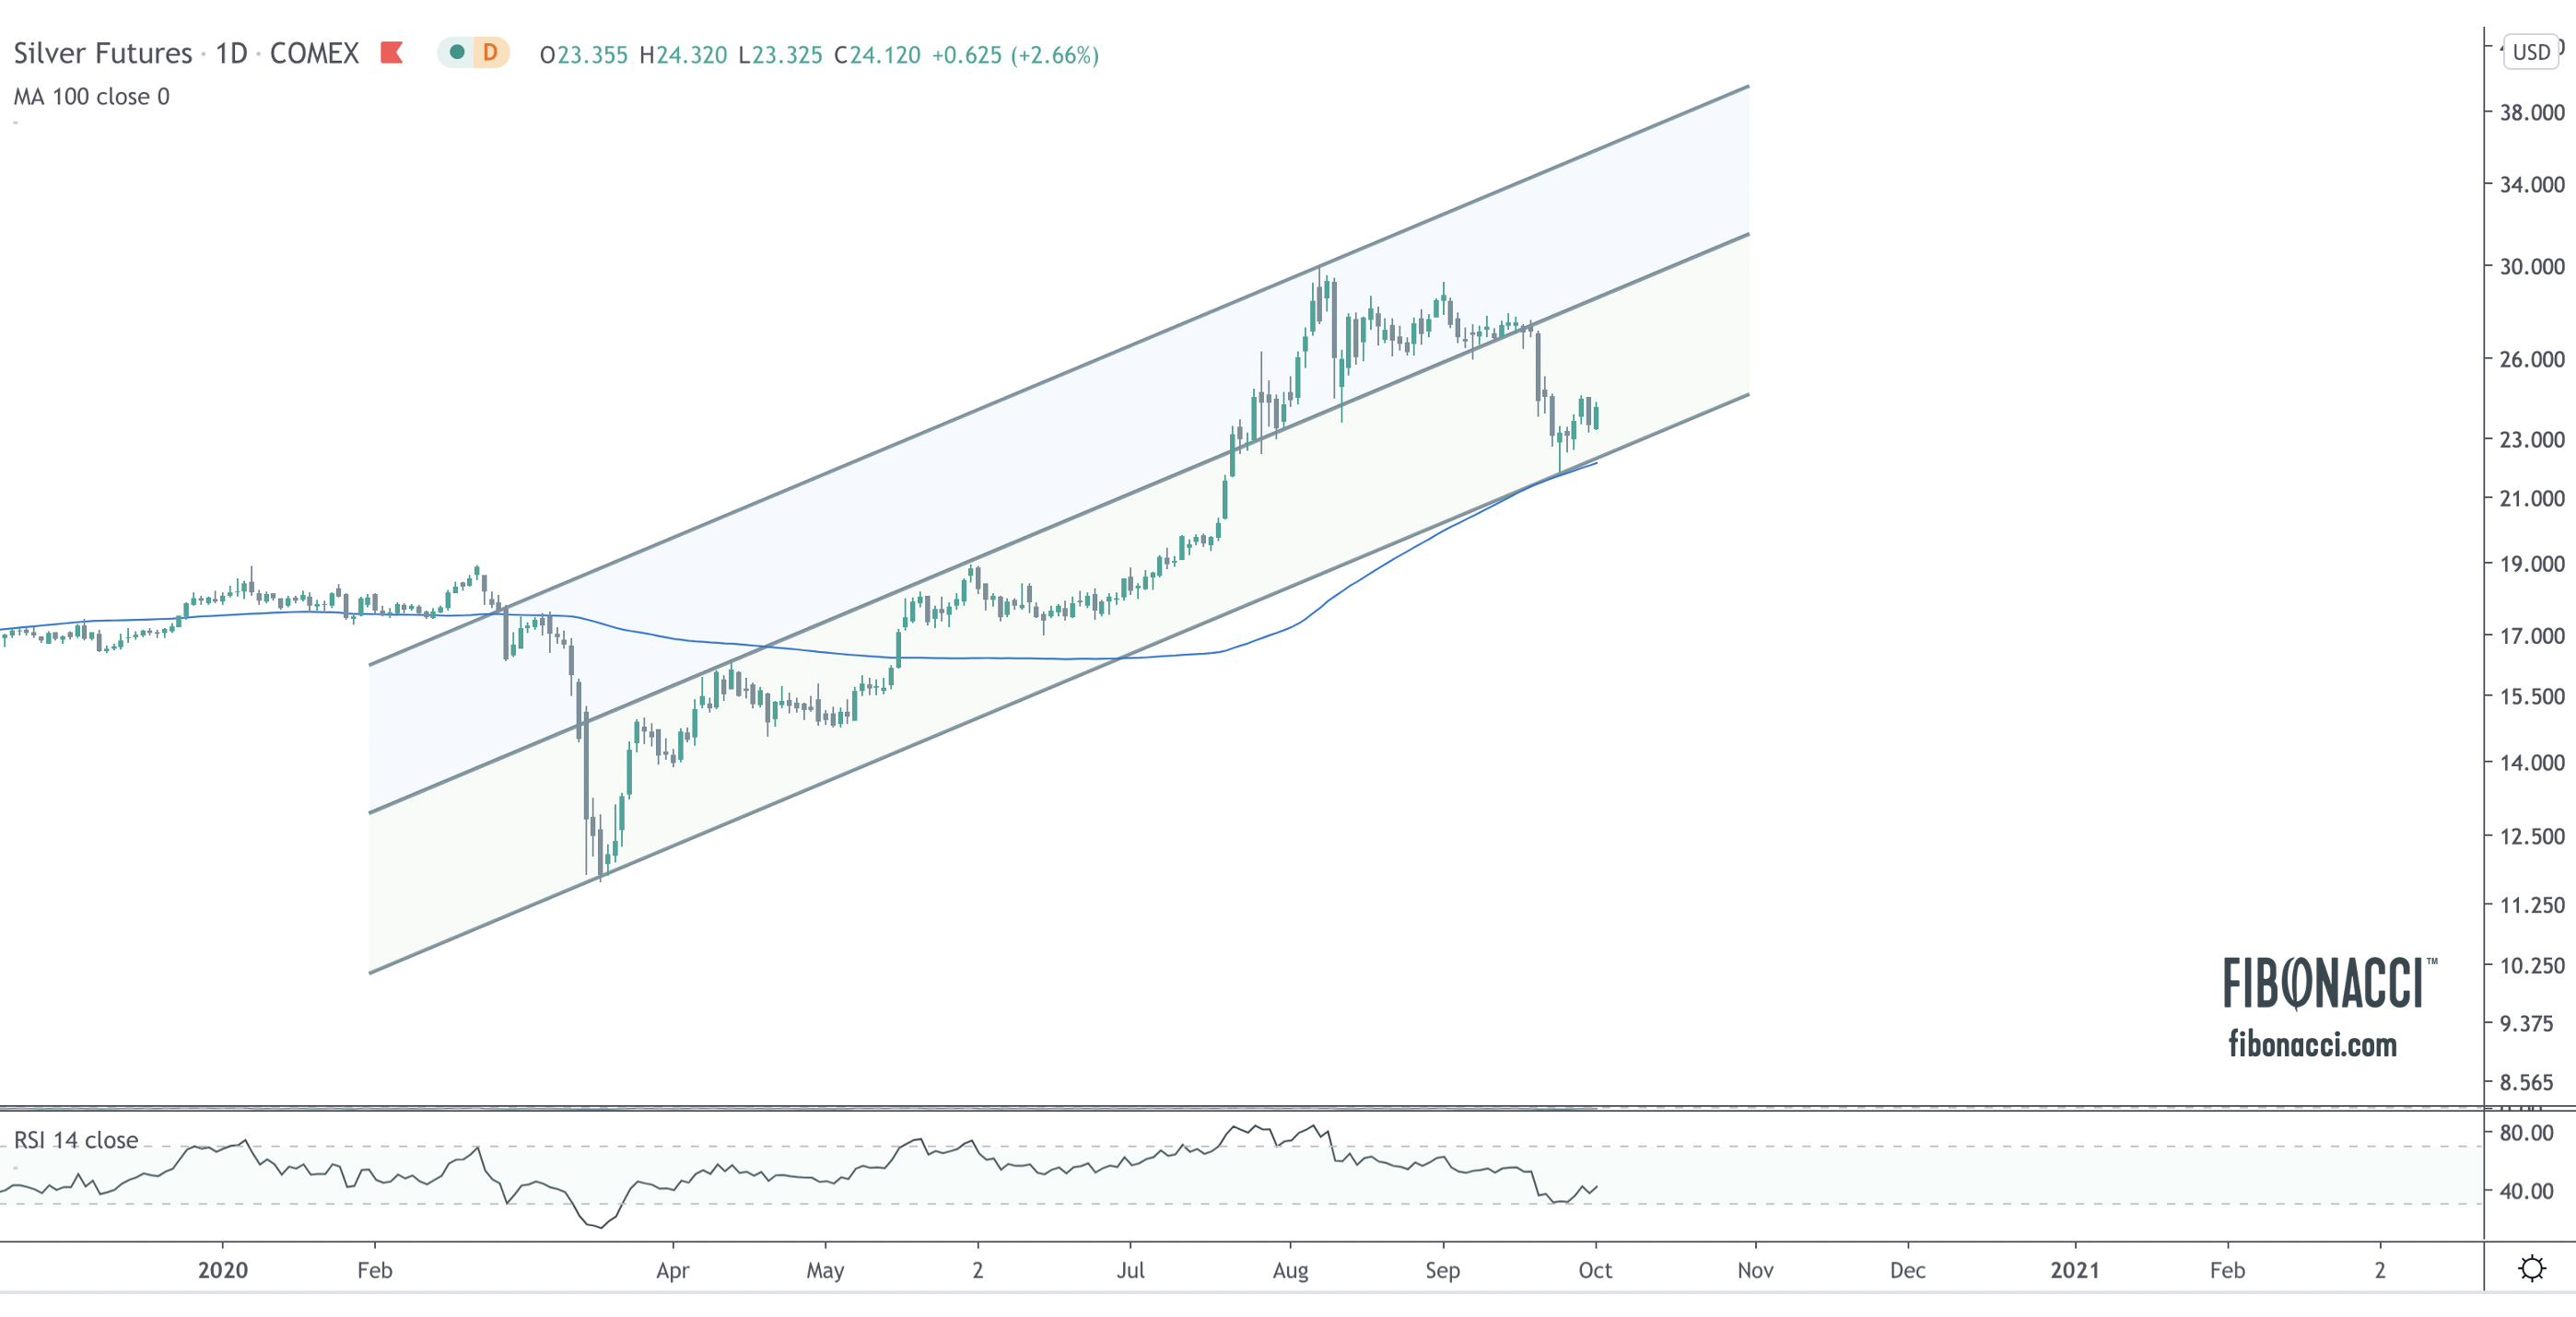
Silver made a statement with yesterday’s bullish move. I noted on election night that silver looked vulnerable and needed to breakout in order to avoid future trouble. Within 48 hours price exploded out of its bull wedge on a $1.60 single day move. The chart looks extremely constructive now. The anchored volume-weighted average price from the March low held throughout the consolidation period, and similar to gold, 161.8 Fibonacci extension from the March low held, the bull wedge broke to the upside, the 50 DMA was eclipsed, and price is now retesting prior support at $26. A move above $26 should push a retest of the 261.8 Fibonacci extension.

Gold/Silver Ratio – false breakout
Earlier this week, the Gold/Silver ratio appeared to be breaking out, which was concerning for bulls. Generally, a rising GSR is a risk-off signal for metals (gold outperforming silver). The big turnaround in yesterday’s price brought the ratio back below falling resistance. As the saying goes – “from failed moves come fast moves.” A weekly close below falling resistance increases the likelihood that the ratio will continue to fall.

GDX and GDXJ Breaking Out Also
The charts of GDX (Gold Miners ETF) and GDXJ (Gold Junior Miners ETF) look very similar. The chart below is that of GDXJ. After breaking out above long term resistance at $52, price has neatly consolidated for three months forming a multi-month bull flag which perfectly retested prior resistance (now support). Yesterday, price finally broke falling resistance of the bull flag. Like gold and silver, these junior miners never hit oversold conditions through the consolidation and appear poised for the next leg higher.

Equities also look constructive
The S&P 500 is up also 300 points from the election night low. The key 3230 level – which has acted as both resistance and support and has been tested four times since May – held. Price is now coming into falling resistance from the August high. 3530 is resistance to the upside. Bulls would like to see a big push through that level to confirm the next leg higher is underway, a run that should take price to ~4,000, which is the measured move from the June breakout and the upper bound of the 12-year rising channel. Like the metals, price never hit oversold conditions on the retest of support and bulls remain in control. On the downside, 3230 remains key support, with the 200 DMA and anchored VWAP from the March low sitting just below ~3115.

The Dollar shows little sign of strength
From a technical perspective, the trend in the dollar is down. This is a fact, not opinion. The dollar has a downward sloping 200 DMA, hit oversold conditions twice during the summer, never was overbought on the short term rally, and remains on the precipice of breaking support again at 92. This is not a chart anyone should be looking to buy. A break above 95 would change the technical outlook.

As always, I would love to hear your feedback!
On the topic of future inflationary or deflationary expectations, there are strong fundamental arguments on both sides. In my simple interpretation, the deflationary camp (dollar bulls) make the case that the economy remains fractured, entire industries are being undermined by the pandemic, there is high unemployment, the personal savings rate is up, the stock market is at stretched valuations, the housing market is approaching bubble territory, and the demand for US dollars remains the prevailing undercurrent of international trade. The Fed, despite its best efforts, cannot seem to meet its inflation target. Further economic weakness or perhaps a market crash would incite a flight to liquidity, demand for dollars to meet debt obligations, and broad debt defaults, further tightening the monetary supply. A strong dollar generally weighs heavily on the price of precious metals, particularly in short-term liquidity crises, and creates the potential for a near term headwind on metals prices.
The inflationary camp argues that the Fed – and policymakers – have shown their willingness to do “whatever it takes” to prop up the markets and inject unfathomable amounts of liquidity into the system. There is seemingly no limit to the tools available for this purpose, as we have seen direct stimulus injections into personal bank accounts, Federal programs such as PPP, and other fiscal interventions. In theory, a $1,200 stimulus check could be a $12,000 stimulus check or a $120,000 stimulus check. The government can continue to print, and can even choose to monetize the national debt.
As a technical analyst, these theories are beyond my capability to fully comprehend in whole or predict with any accuracy. I simply look at the charts to determine primary, secondary, and tertiary trends, and what those trends communicate about the environment now. My job is to react to what the market. On that point alone, this is what I see.
The dollar is trending down

The primary, multi-decade trend in the dollar remains down. From 2008-2017 the dollar produced a powerful countertrend move that culminated in its third multi-decade lower high. This countertrend move broke down in March, has since pulled back to retest the breakdown, and appears poised for another leg down. The topping pattern formed from 2015-2020 appears to be a diamond reversal pattern. The primary downtrend would be violated only if price moved above falling resistance represented as the upper bound of the falling channel. So, in brief, the long term trend is down, the bullish, decade-long countertrend appears to be over, and it would appear that further weakness is ahead.
Gold is trending up

Conversely, gold is trending up. The countertrend bullish move in the dollar coincided with a countertrend bearish move in gold, which created a 7-year base (continuation pattern) that broke out to all-time highs this year. Gold remains in a 20 year uptrend, and the breakout to new all-time highs suggests that the primary trend is resuming its upward thrust.
The stock market is trending up

The S&P500 also remains up. While a crash may be in the offing at some point in the future, the 12-year trend remains up, and even the historic Covid selloff in March was notably just a back test of the two-year price shelf from 2015-2017.
The S&P500 priced in gold is trending down

Gold outperformance relative to equities remains noteworthy. The primary, 20+ year trend remains down. During the period from 2011-2018 when gold was basing, the S&P500 outperformed gold, but this entire moved appears to be a countertrend 38.2% Fibonacci retracement, which broke down in 2019 and now appears to be resuming the downward trajectory of the primary trend. This trend suggest further gold outperformance even if the nominal price of each rises in tandem with a weakening dollar.

The same chart with only the 50 week moving average and 200-week moving average shows only three crosses over the past 20 years. These crosses are infrequent, and the 50 week MA falling through the 200-week MA in March would seem to confirm the expectation of further downside pressure in this ratio.
As always, I would love to know your feedback.
GOLD
The price coiling I highlighted in gold in my last post failed to the downside, which I mentioned was a possibility. There were two key levels, the 1865-1880 band, and then 1800, which would have retested the entire move. Buyers came in strong at 1865 and price held, right at the 100 day moving average. The breakdown from the pennant has created a bull wedge, and the RSI (relative strength index) never hit oversold levels, which implies to me that bulls remain in control. Gold is not completely out of the woods – a breakout of that bull wedge would confirm that 1865 was the interim low. I am looking for confirmation above 1935 and then 1950 for next sizable move. The price action in silver and the miners confirm this thesis.
SILVER
Like gold, silver never got oversold on the 14-day RSI during the recent selloff, and price similarly bottom-ticked the 100 DMA. A break above the recent high of 24.57 should set up a retest of 26.
GDX – Gold Miners ETF
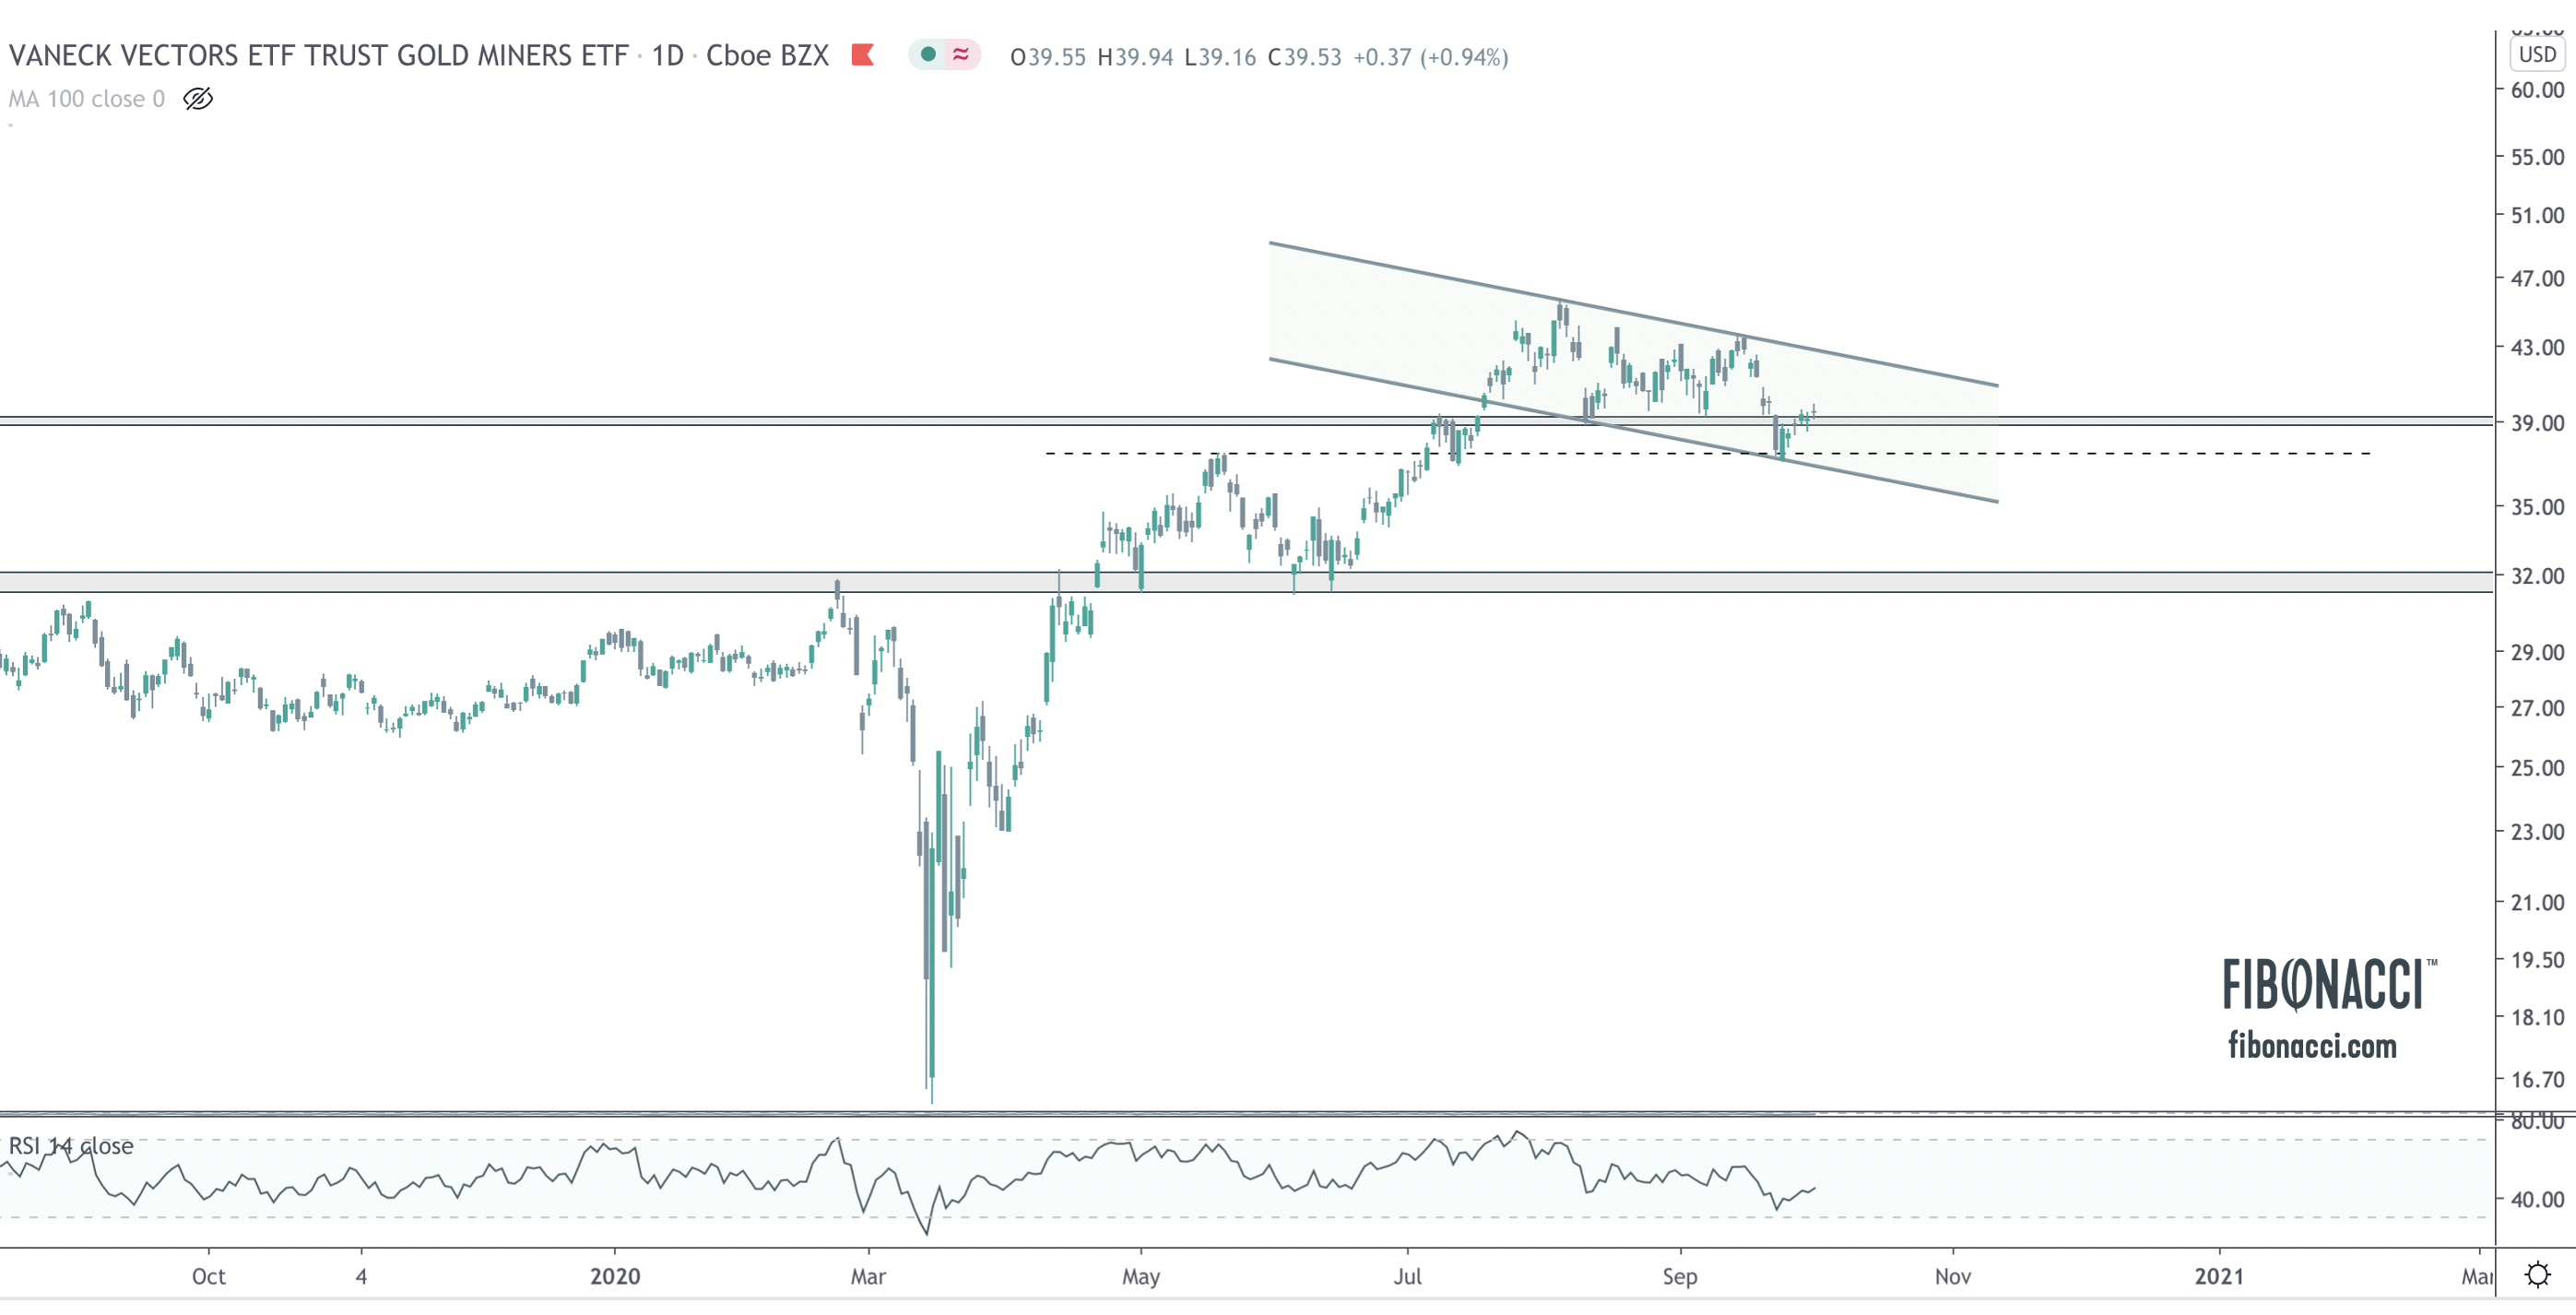
GDX appears to have successfully recovered support at 39. At the moment, the recent sell off looks like a false breakdown from horizontal support, and price has formed a bull flag during this recent consolidation. Like the metals, RSI never got oversold during the sell off. This looks to me like a 2-3 month healthy consolidation in order to digest the explosive gains from the March low. Bulls just need price to stay above 37.
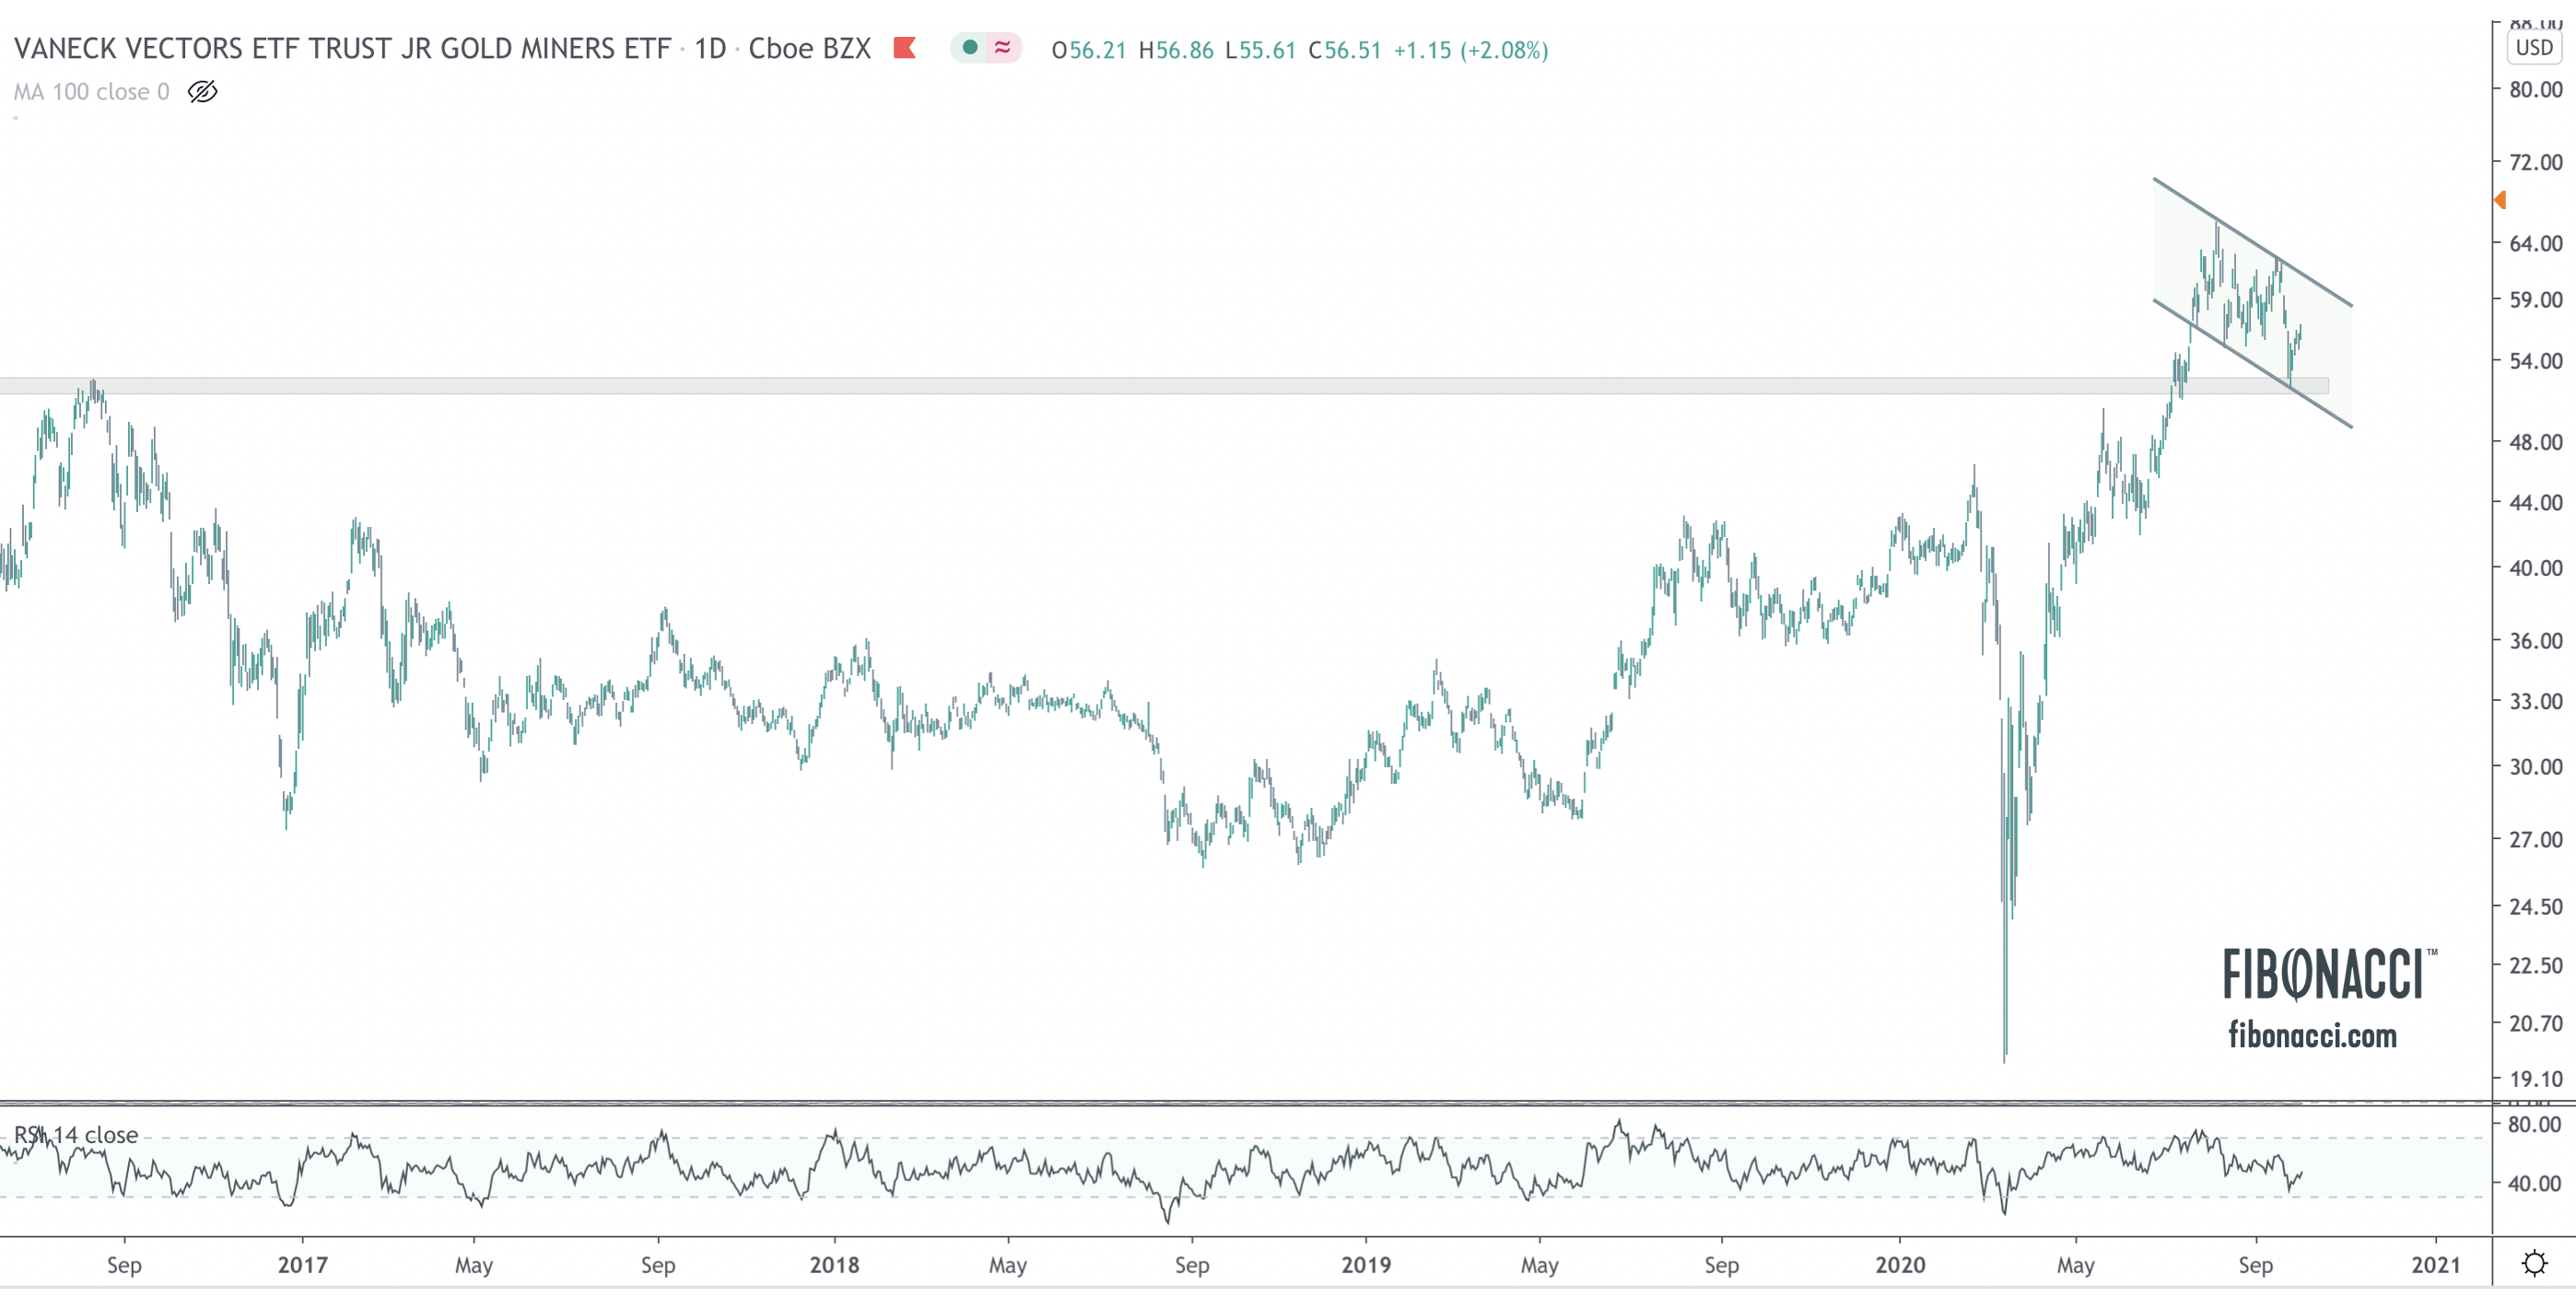
GDXJ – Junior Gold Miners ETF
The junior gold miners look even better than the majors. The entire selloff has been a simple retest of the breakout from the 2016 high. Like GDX, price has just been consolidating for 2-3 months and has formed a bull flag into support. RSI never got oversold during the selloff. Bulls want price to stay above 52.
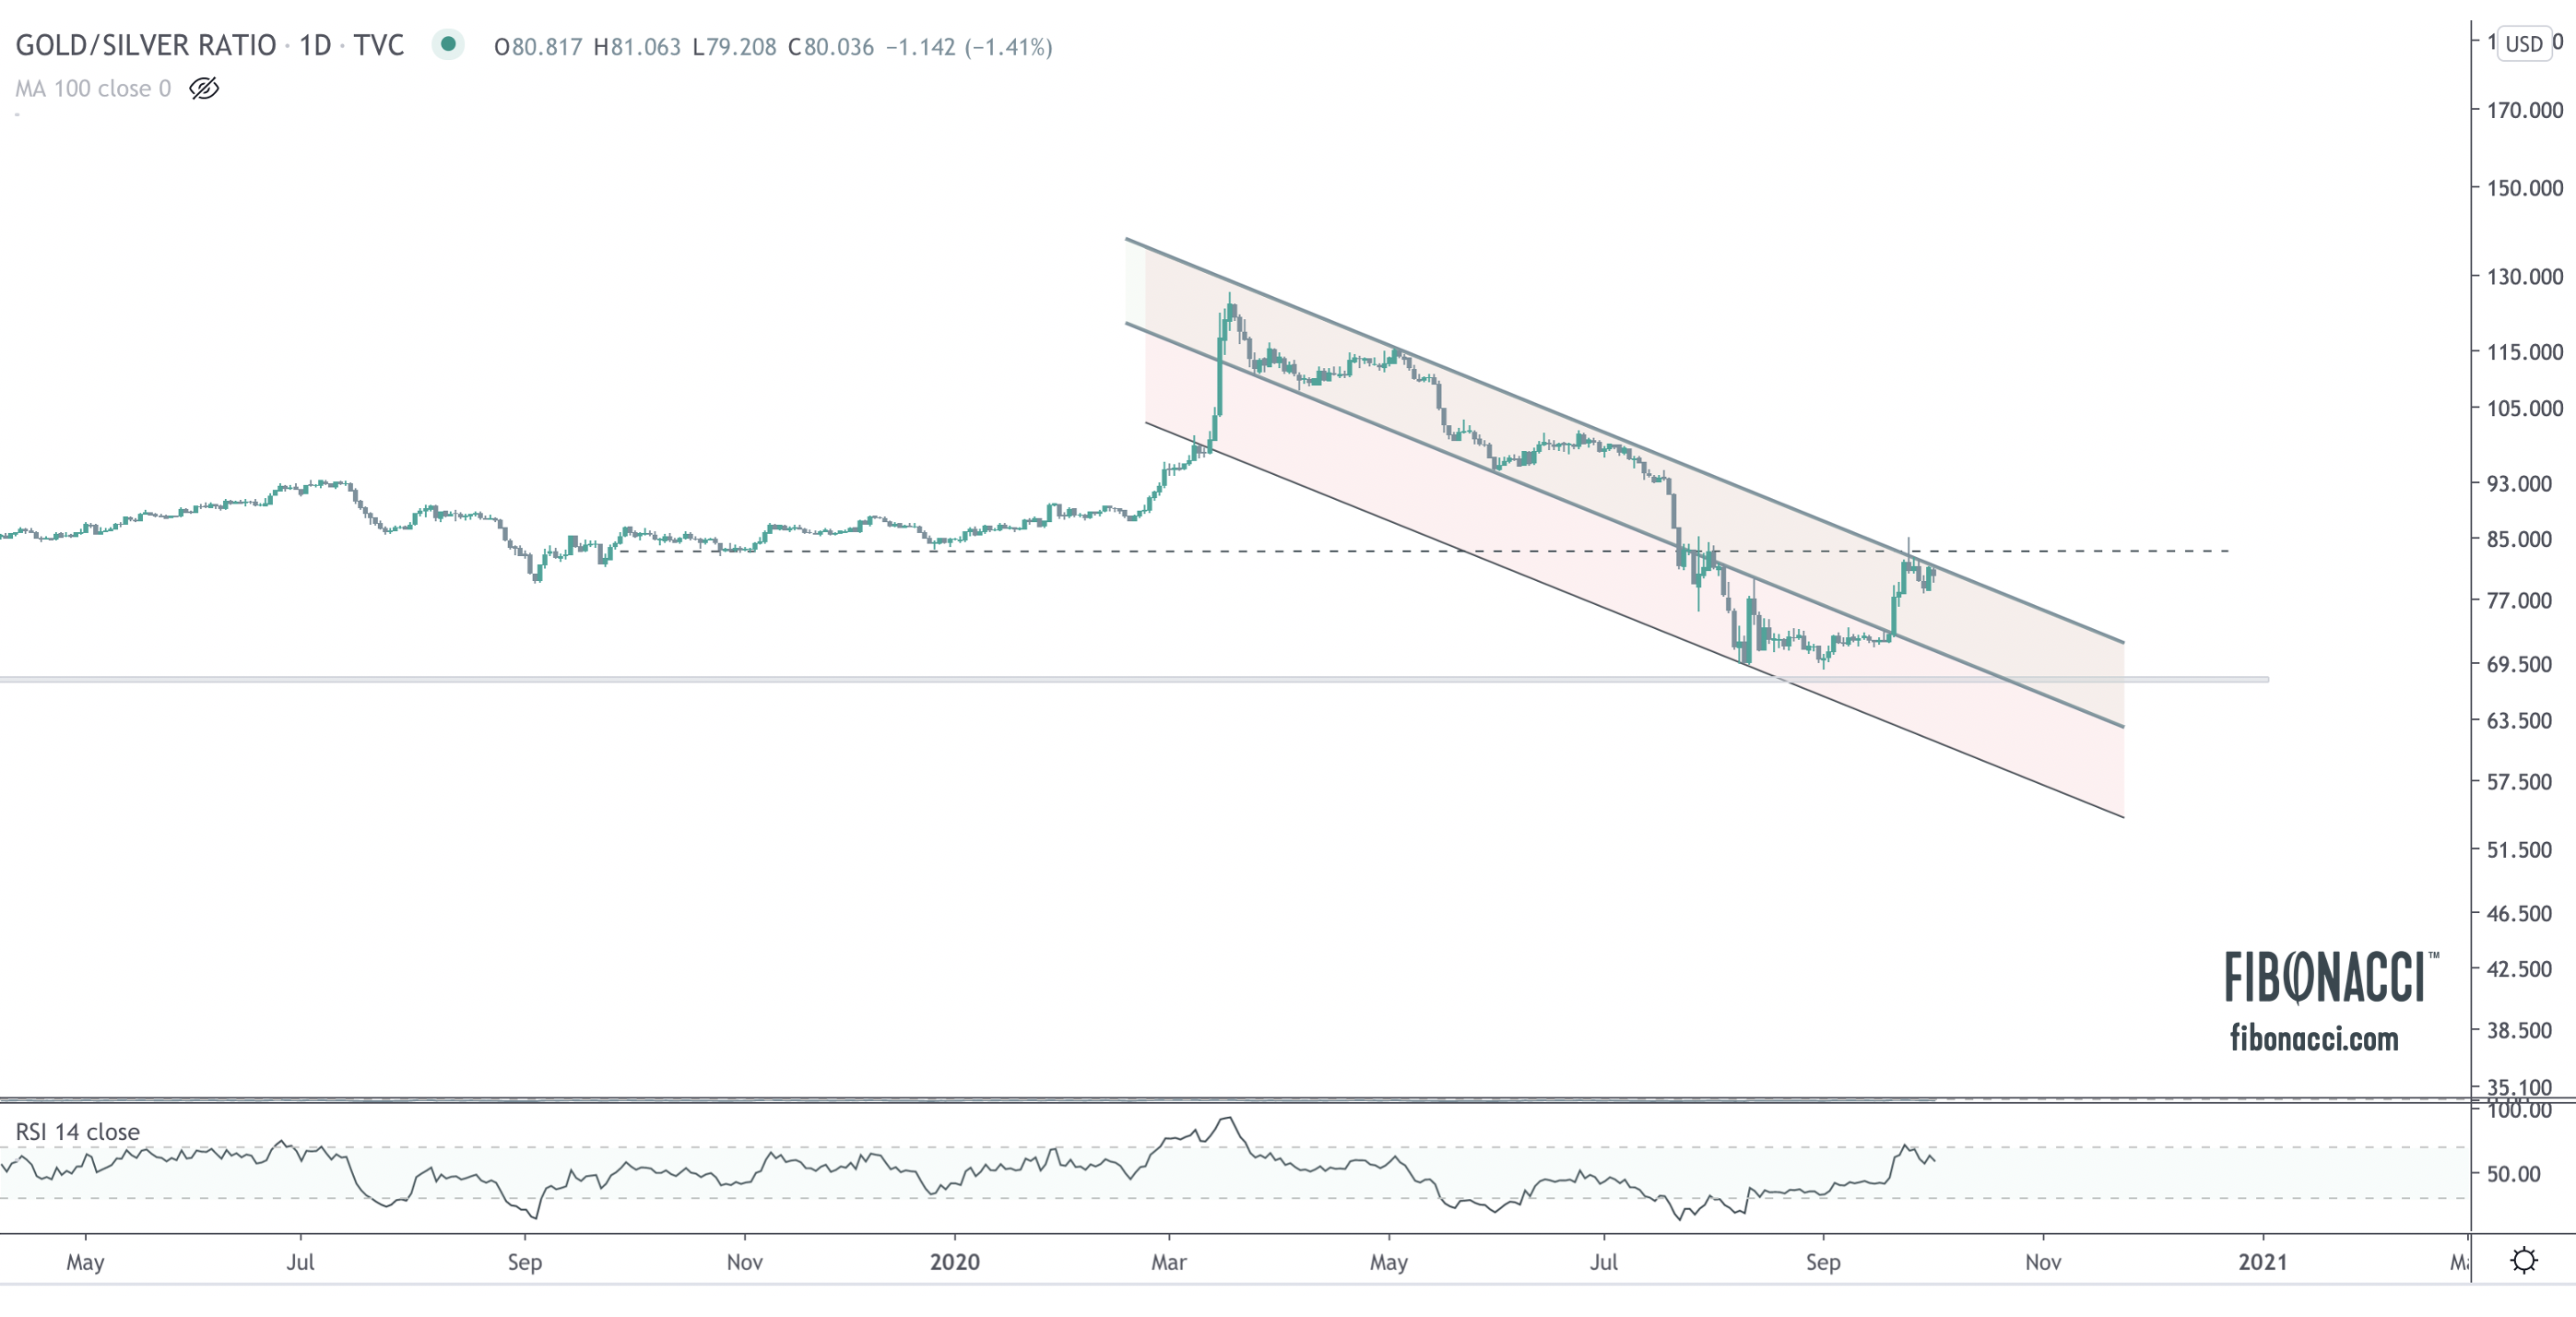
GOLD/SILVER RATIO
In a bull market, we want to see silver outperforming gold on a relative basis, which implies a lower ratio. In the chart below, we can see that the trend remains down, and the ratio is pushing up against falling resistance. A breakout in price should send the ratio falling back towards a retest of the 68 level. In this case, we notice that the RSI was “oversold”, meaning the downward fall became extreme, and the pullback never hit overbought levels, which implies that the downwards pressure is prevailing. These signs indicate silver outperformance, which is far more prevalent when prices are rising than when they are falling. A breakout of this ratio would imply a skew towards risk off, which would be less bullish generally.
As always, we would love to hear your feedback.
GOLD
This is an update from my post on Friday:
Gold broke down from its pennant yesterday and hit first support at $1880. Price remains in a bull flag, but a break below $1875 should see a quick drop to $1800, which would be a backtest of the entire breakout.
GOLD
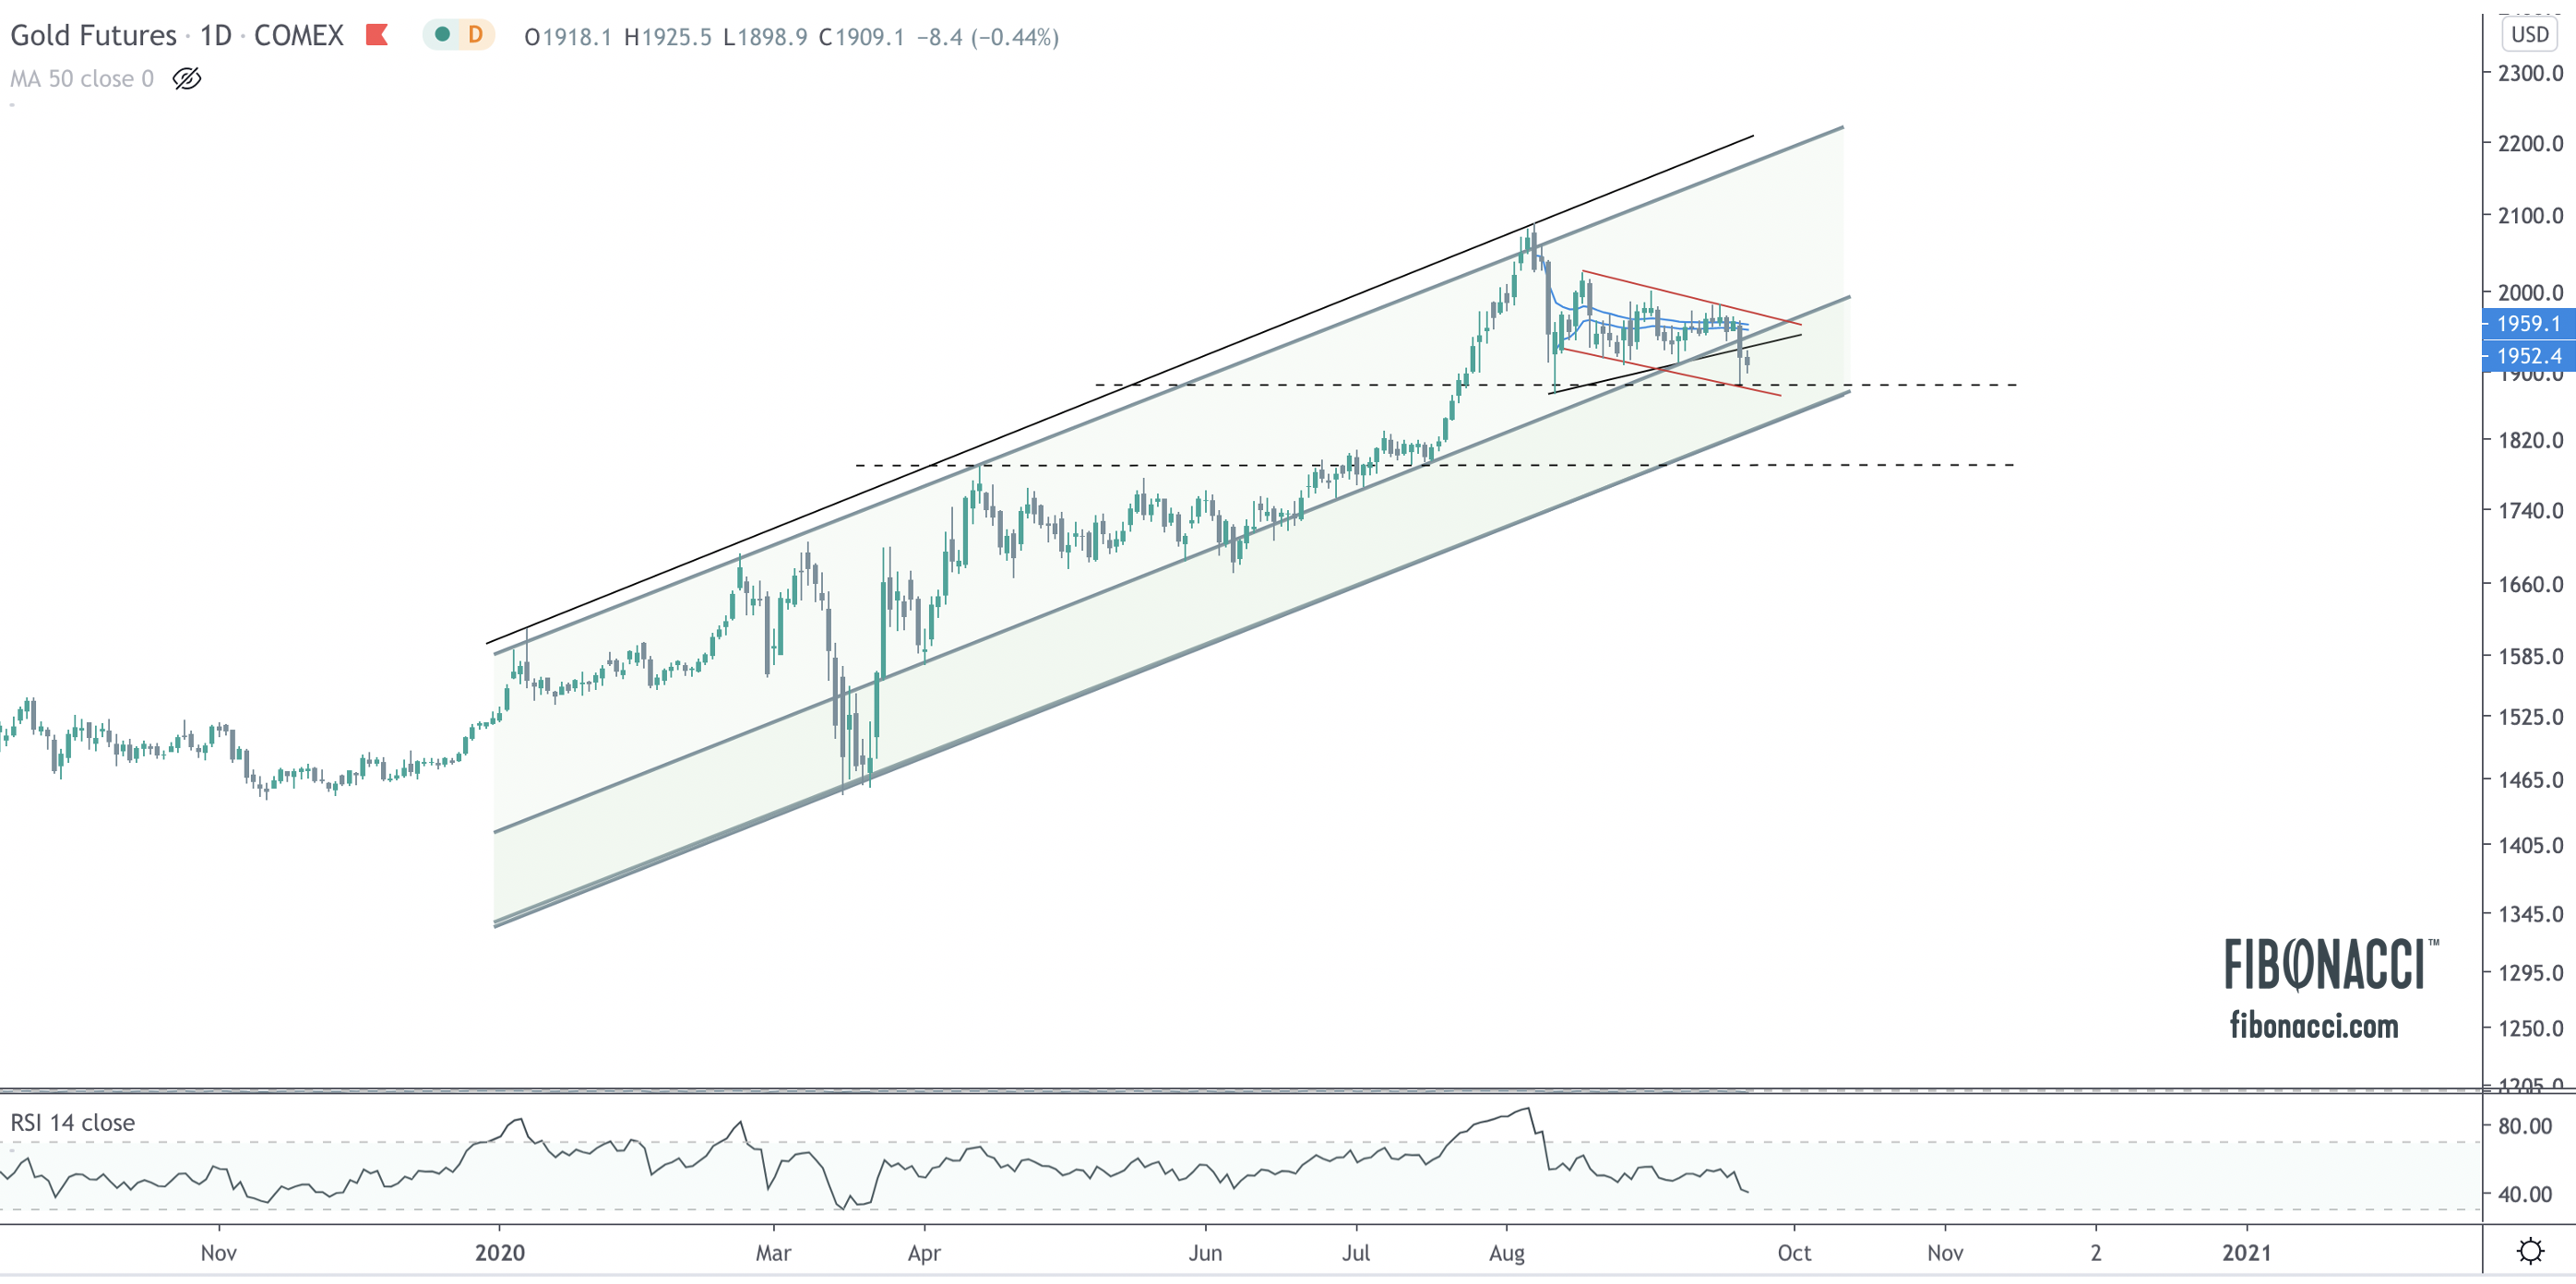
Since mid-August, sales in the physical precious metals market – red hot at the peak of the COVID outbreak – have begun to taper off slightly. This slowing of demand is directly correlated to price action. I will focus on gold specifically. 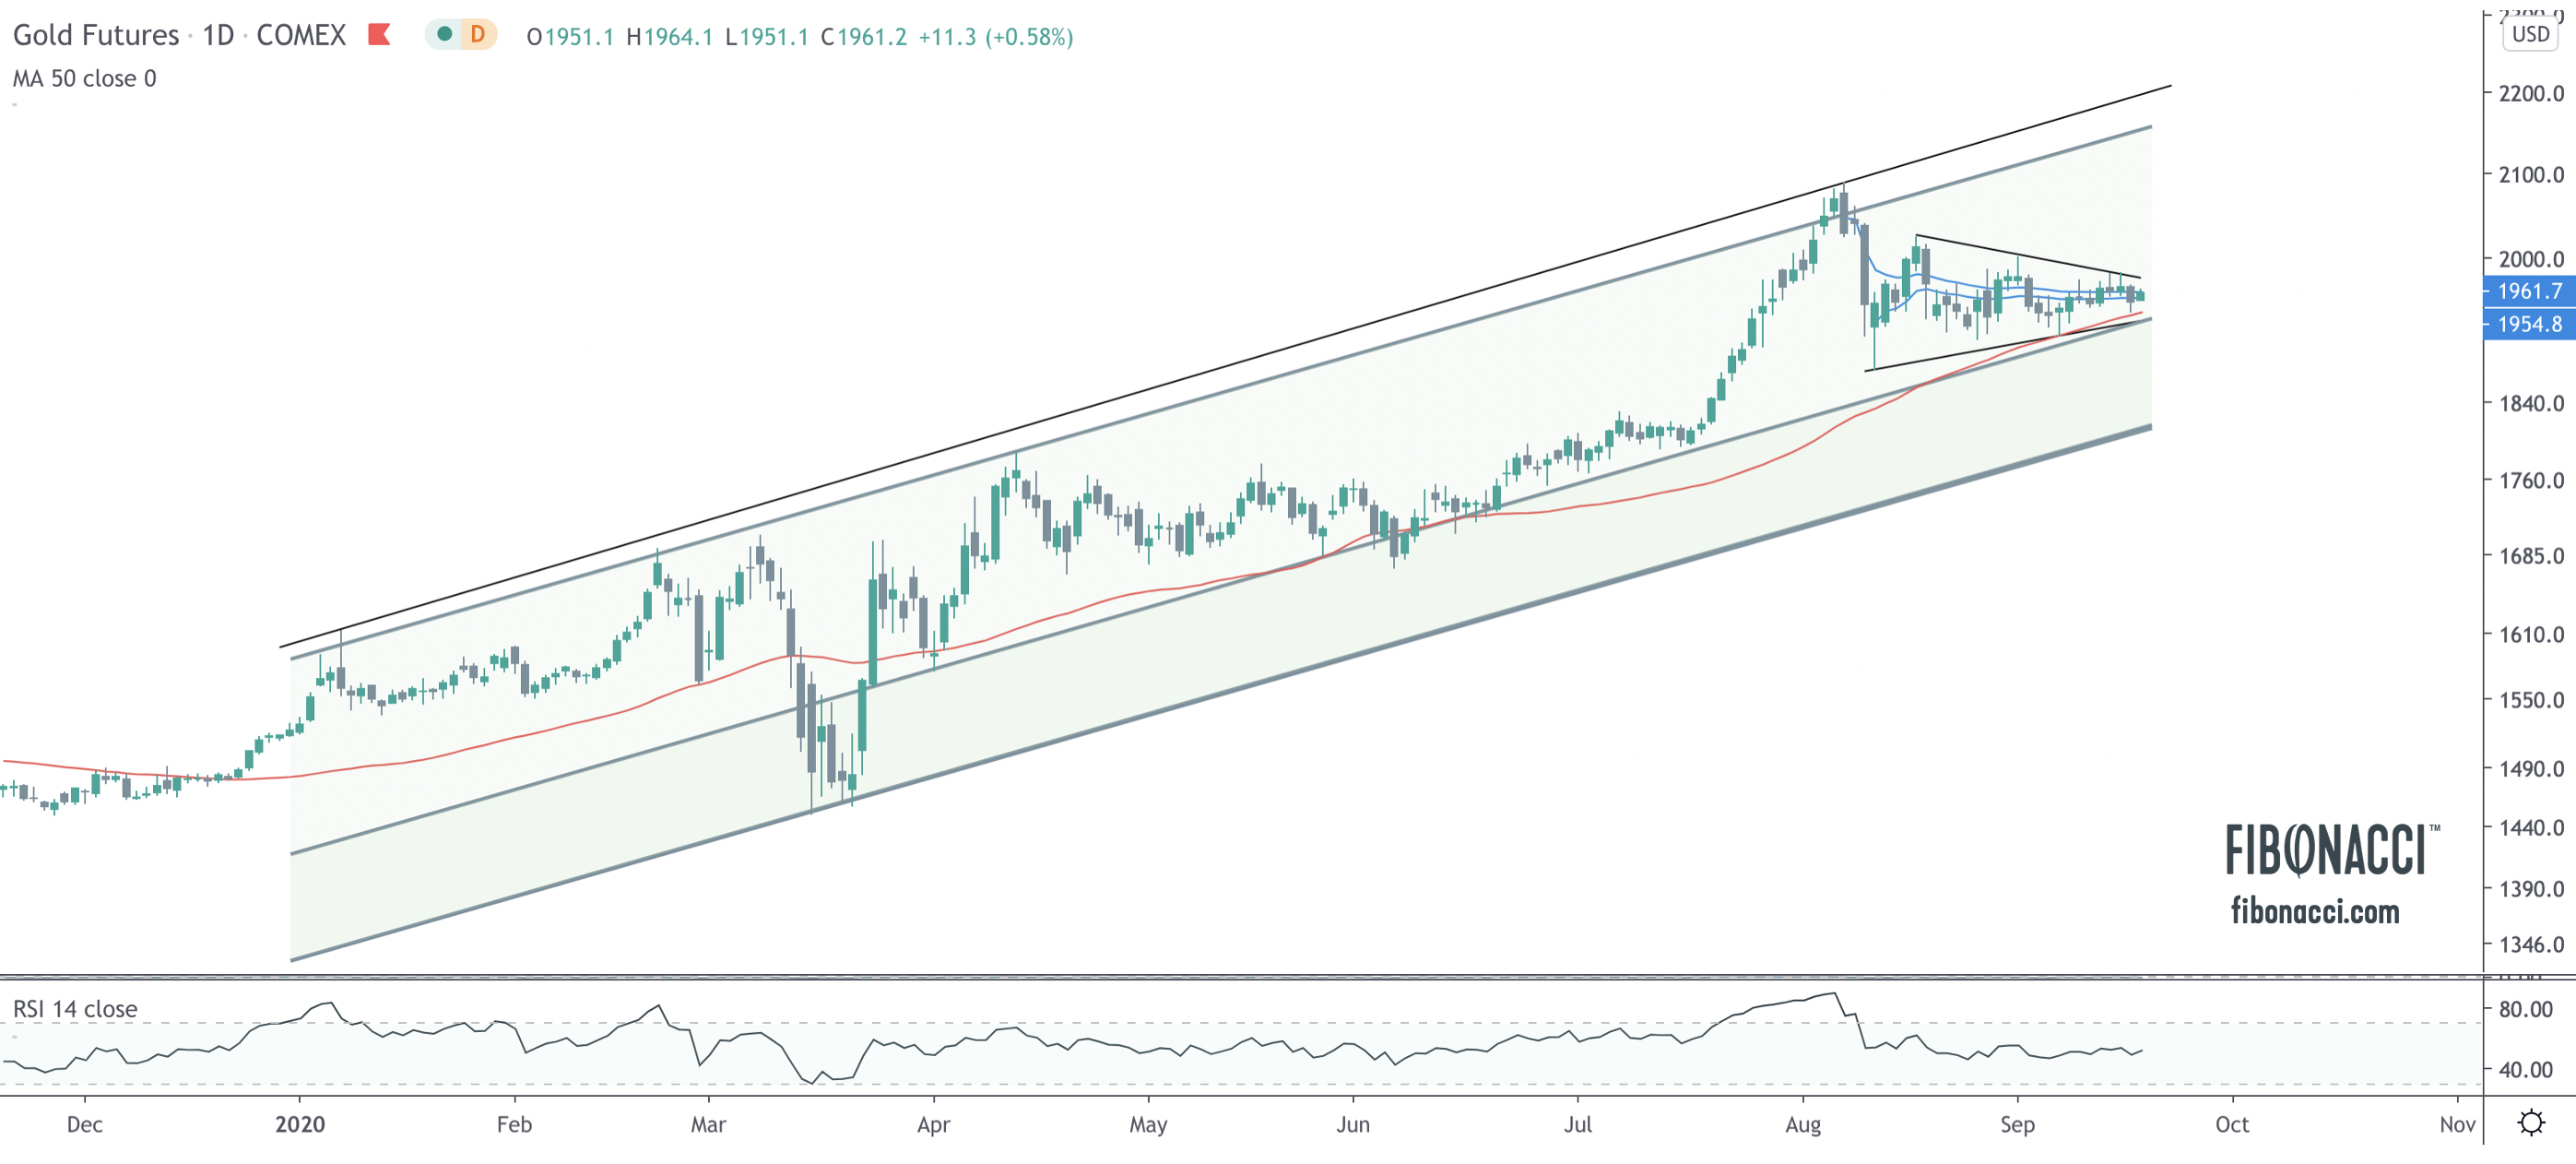
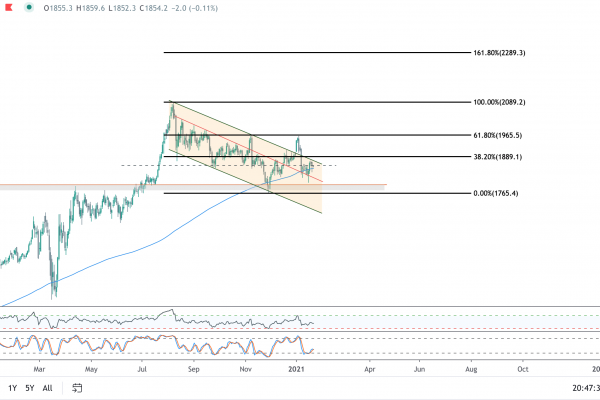
A closeup of the gold chart shows a narrowing and tightly wound price coil of lower highs and higher lows. This narrowing trading range has formed a symmetrical triangle (pennant formation) that probabilistically favors a move in the direction of the underlying trend (60/40). At present, the equilibrium in the market is notable: price is sandwiched between the anchored VWAP (volume-weighted average price) from the August high to the August low, slightly above the 50-day moving average. Price remains in the center of a price channel formed by the March high/low. Relative Strength (RSI) is static at 50, right in the middle of its range. Periods of tightening price equilibrium and consolidation are healthy in uptrending markets as the market digests new prices. As we approach the apex of this coil, gold appears to be setting up for a very big move.
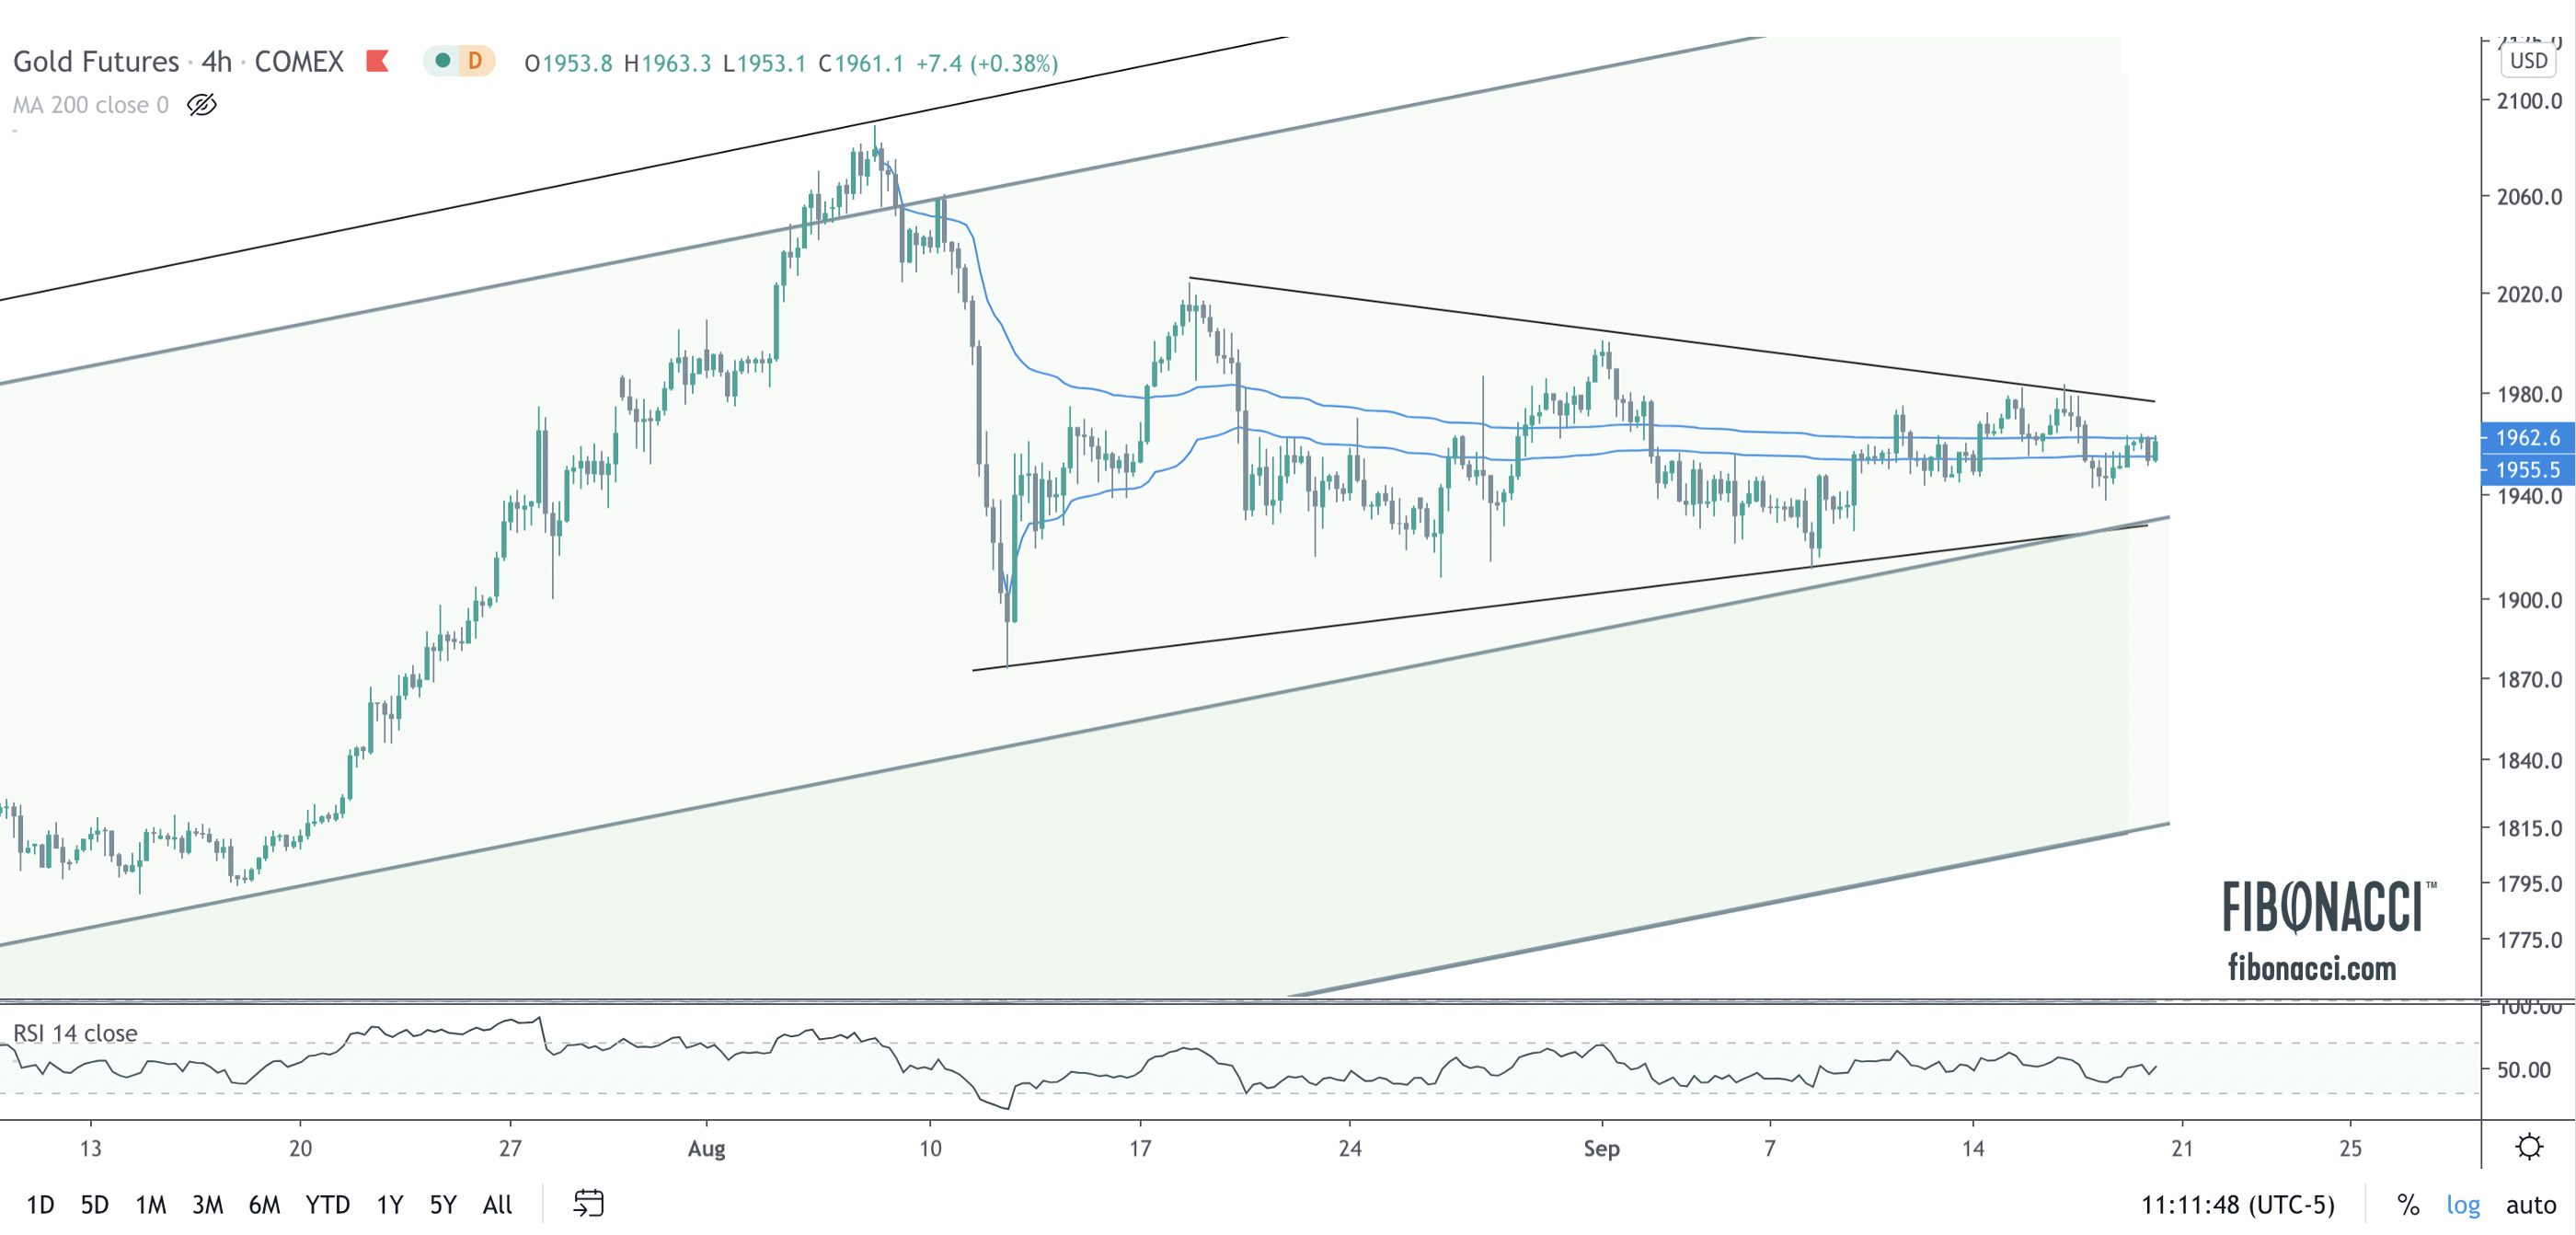
The downside risk remains on a break of $1930 to $1880, and then possibly a full retest of the breakout at $1800. At present, this looks less likely to me. Meanwhile, a breakout above $1980 would setup gold on a path to $2300. Resolution is coming soon – likely late September/early October.
In a stark reversal from the collapse of nearly every market just six months ago, the winds of inflation have pushed the sails of those same markets back to new (or near) all-time highs. The rebound from Covid has been a V-shaped recovery, not an L-shaped, W-shaped, U-shaped, or some-other-letter shaped recovery. The move in asset prices should not be conflated with an underlying economic return to normalcy – far from it. The rebound is simply a commentary on price.
Let’s start with my favorite markets – precious metals: (more…)
The precious metals market is very clearly in a secular uptrend and prices look poised for further significant upside into the end of the year. My technical view is that in the short term prices have gotten a bit extended and that a pull back/consolidation is due (and healthy) to build the base for the next leg higher. (more…)
Precious metals prices broke out this morning above key resistance levels in the mining sector as well as the underlying futures market for the raw metal.
The sell off in markets accelerated by coronavirus and the global reaction to curtail the pandemic has left no prisoners, as nearly all asset classes are selling off in a flight to liquidity. As large institutions face margin calls, they are forced to close positions or raise cash by selling anything and everything that is liquid. Gold and silver – the “safe haven” assets – are no exception. I would remind readers that in the global financial crisis gold fell 27% and silver fell 55% in nominal terms. Gold outperformed equities on a relative basis, but silver actually underperformed.
Fear or Greed?
The last two weeks have been extremely volatile in the markets, and for the first time in a long time my friends and family have called to inquire about “what is going on in the markets?” Coronavirus contagion fears, coinciding with all-time highs in the markets, has been the scapegoat for a rapid, deflationary decline across nearly all markets except bonds, which resiliently continued to fetch a bid. Even the US Dollar, traditionally a safe haven in deflationary swoons, declined.