Gold
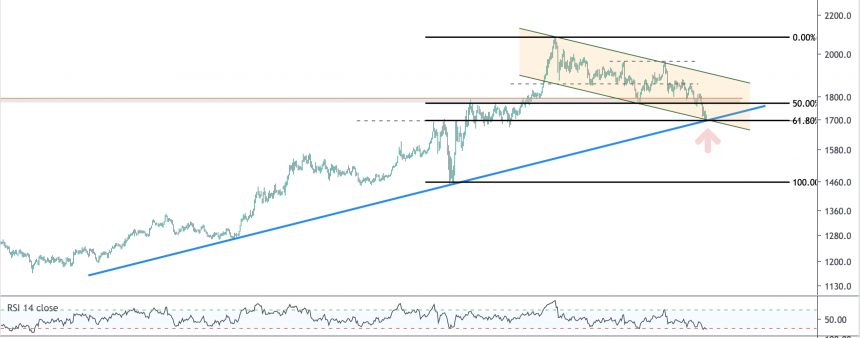
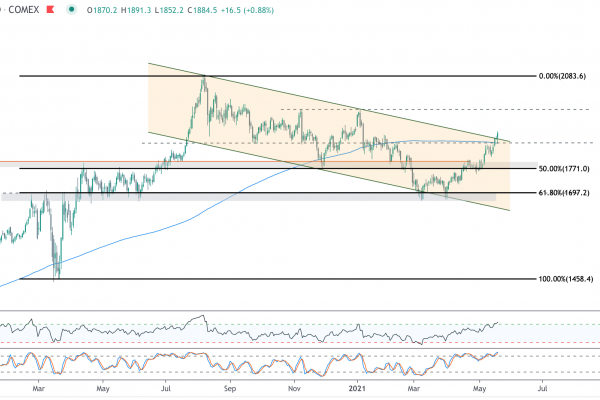
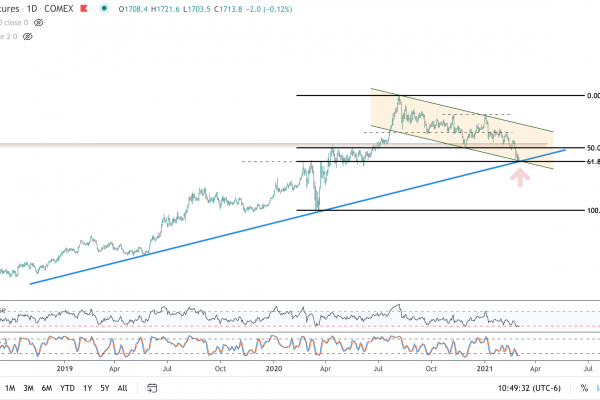
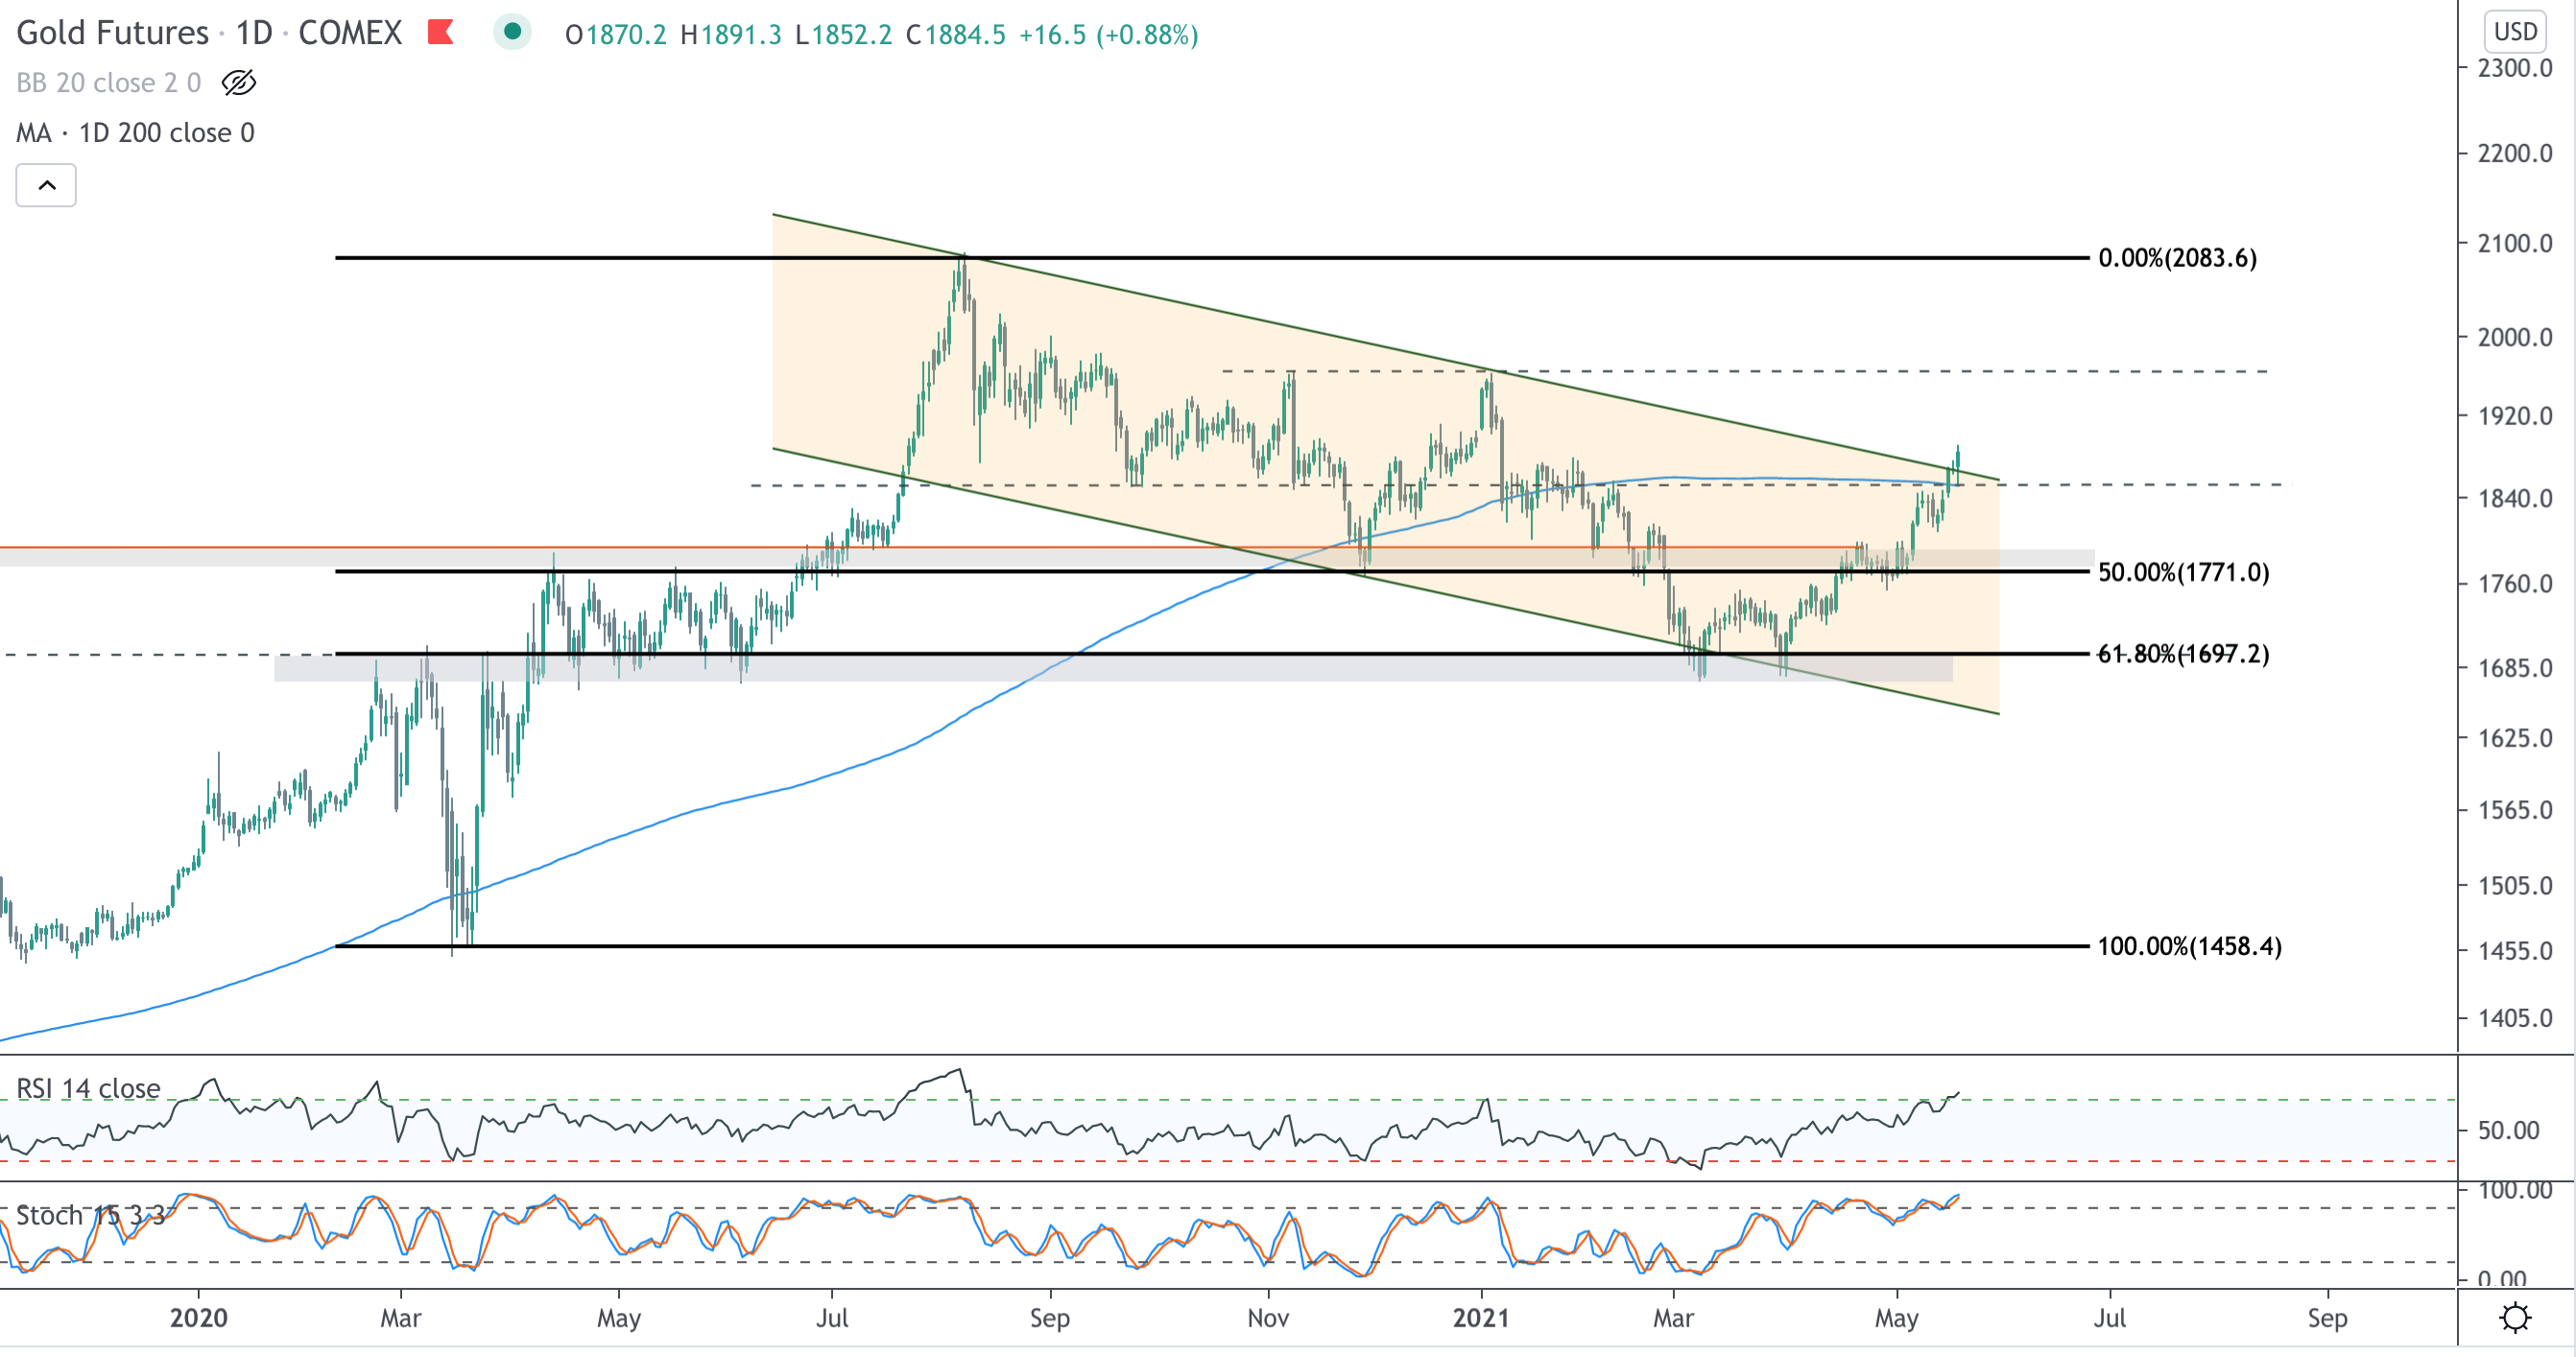
It has been awhile since I posted an update on metals, largely because metals have been stuck in quiet consolidation mode until the past week or so. We have been watching falling trend channel resistance on gold for the past six months, and after the double bottom in March around the 61.8% Fibonacci retracement, gold has steadily climbed, recapturing the 200 day moving average for the first time since February 2nd and breaking out above falling resistance of the multi-month bull flag that commenced with the August ’20 peak. Price action looks exceedingly constructive here, with RSI now in overbought territory for the first time in nine months. Bulls want to see price hold the 200 DMA, or at least stay above 1840. There is blue sky to 1965 if it does.
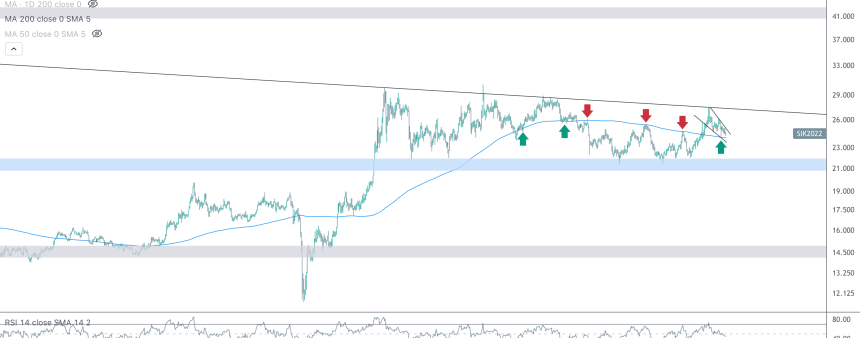
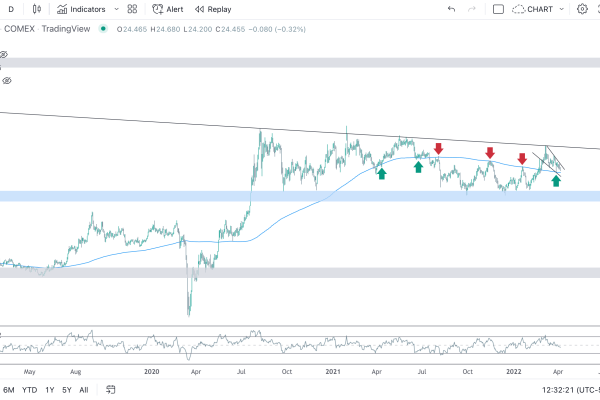
Silver
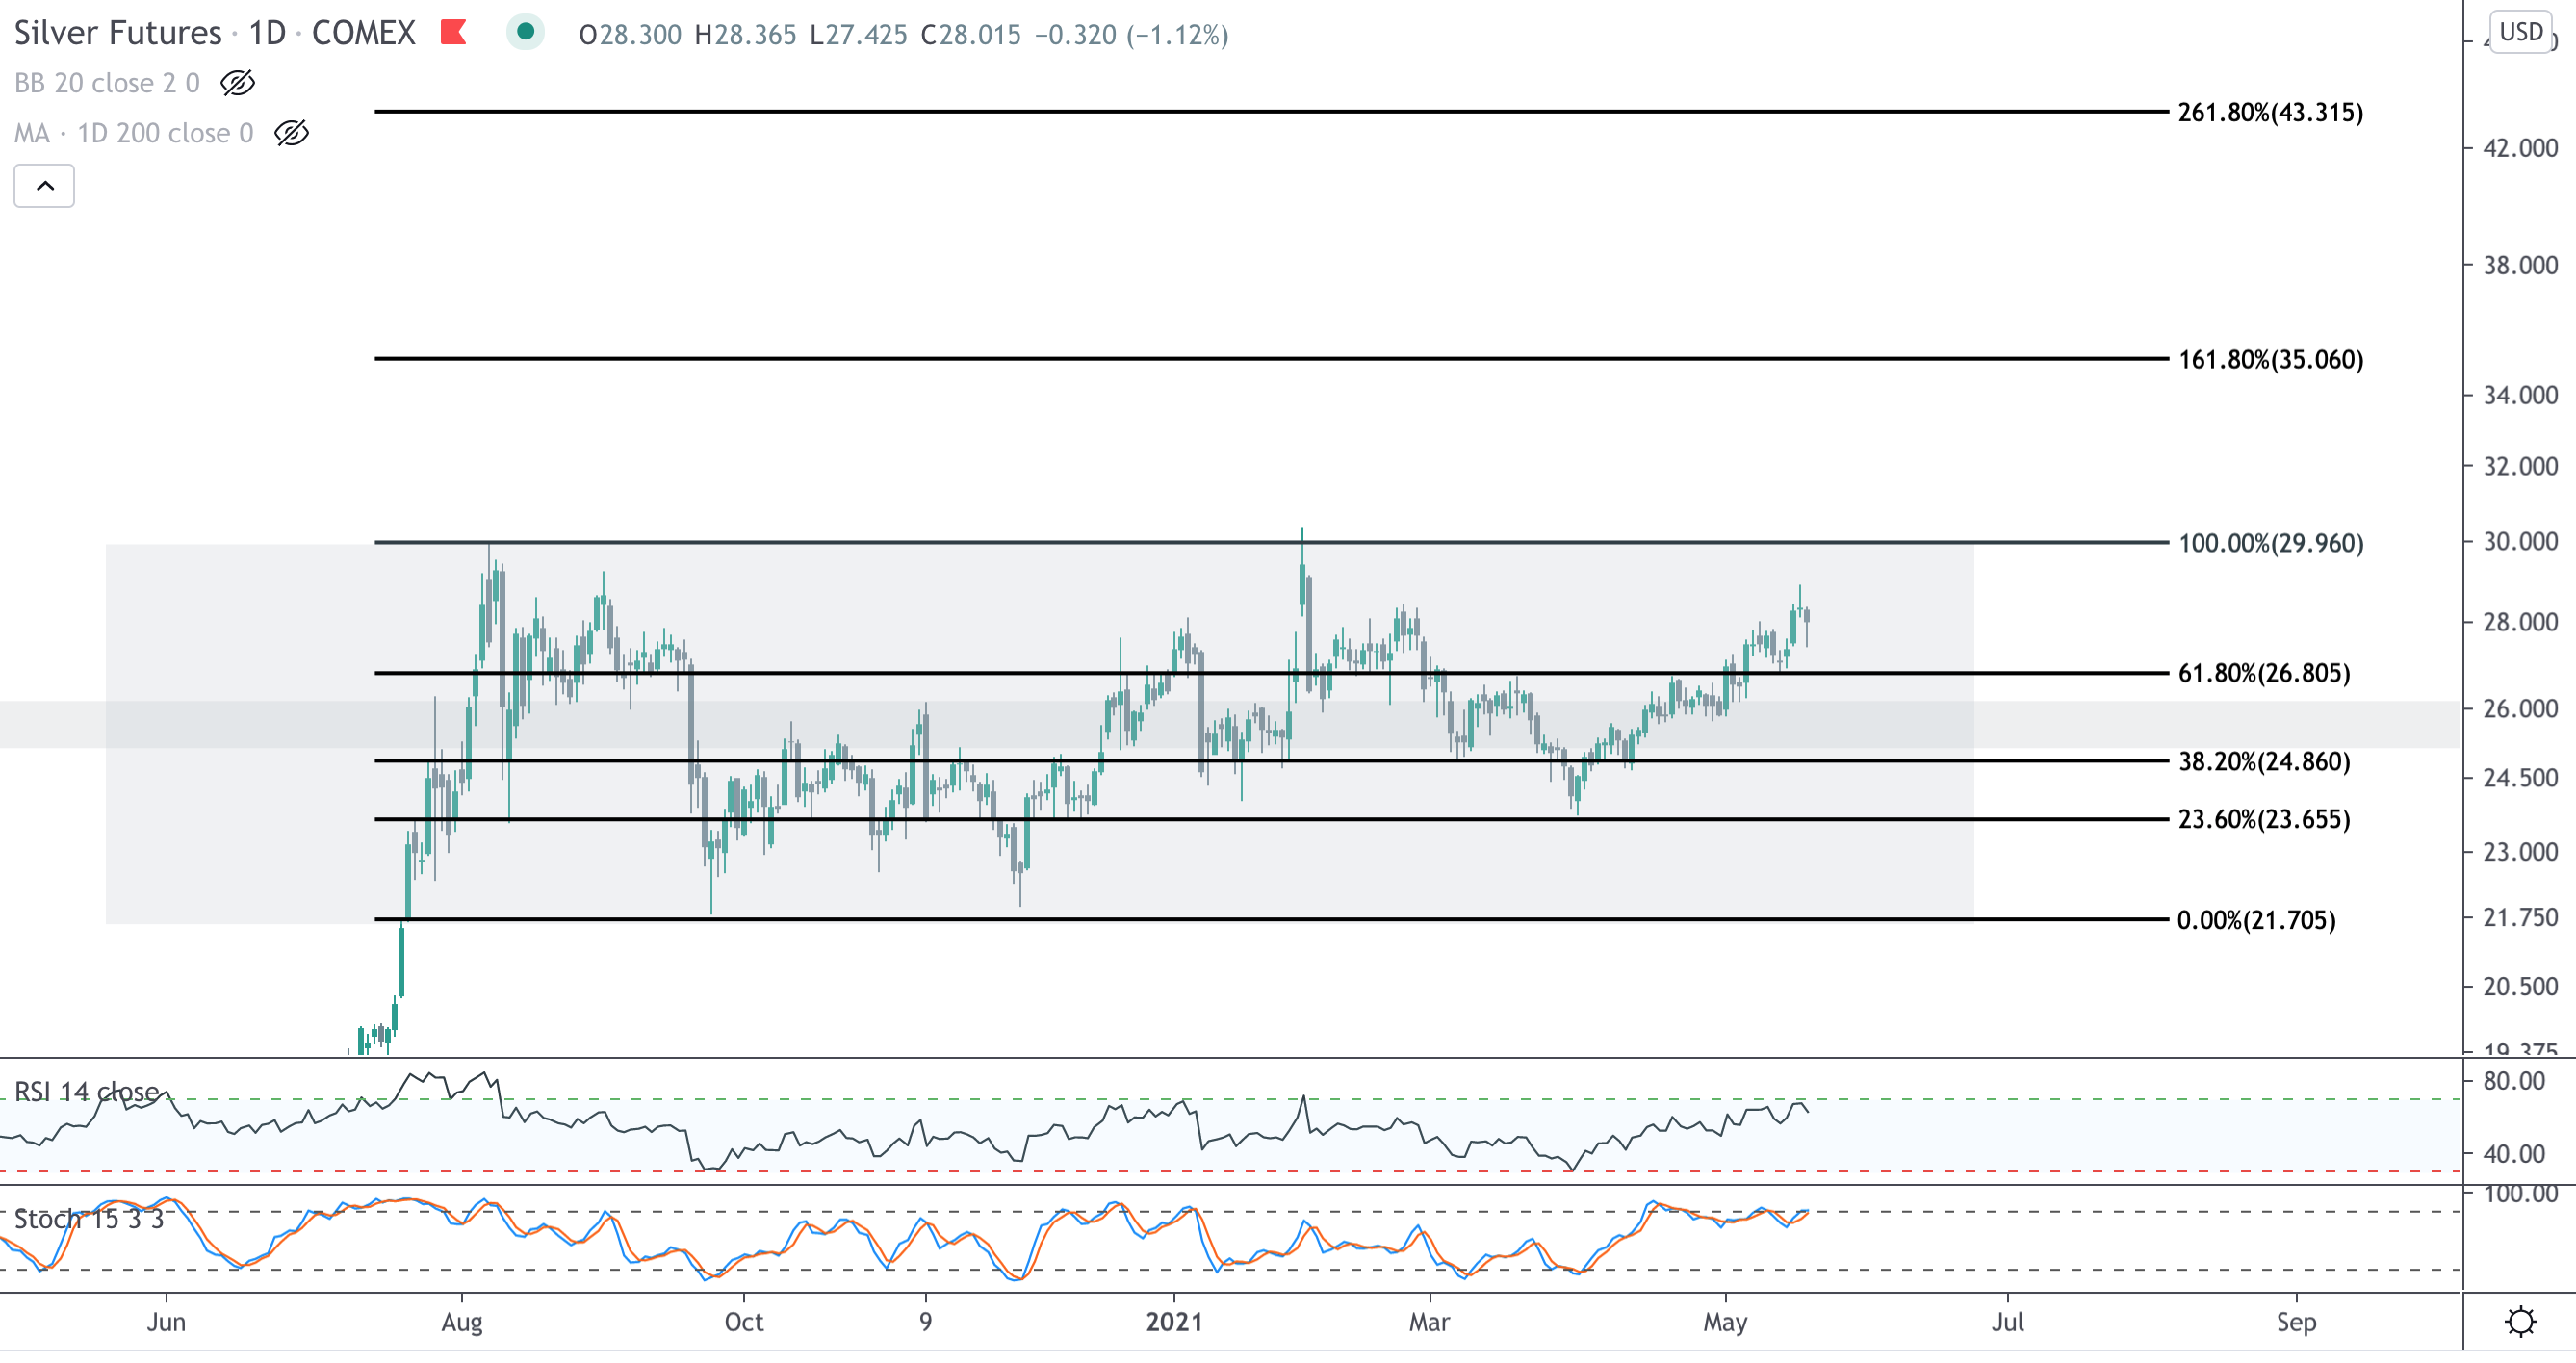
Gold has been the laggard. Higher beta silver, as well as mining stocks, have led the way. Silver broke the 200 DMA in early April, and has once again hurdled the troublesome 25-27 area. Bulls need silver to hold 28.50 for a retest of 30, which it struck twice in the last nine months. A break of 30 should precipitate a swift move to the 161.8 Fibonacci extension at 35, which coincides with the October 2012 peak.
Gold Miners
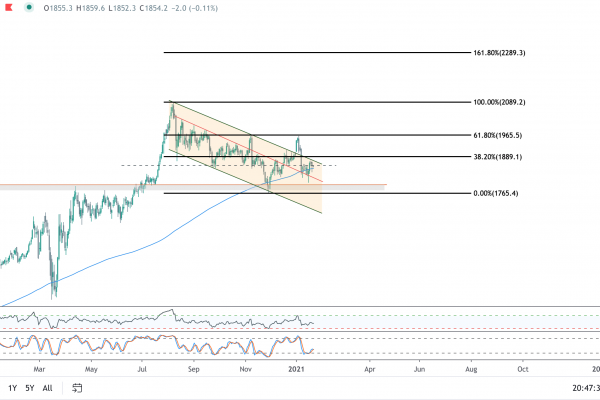
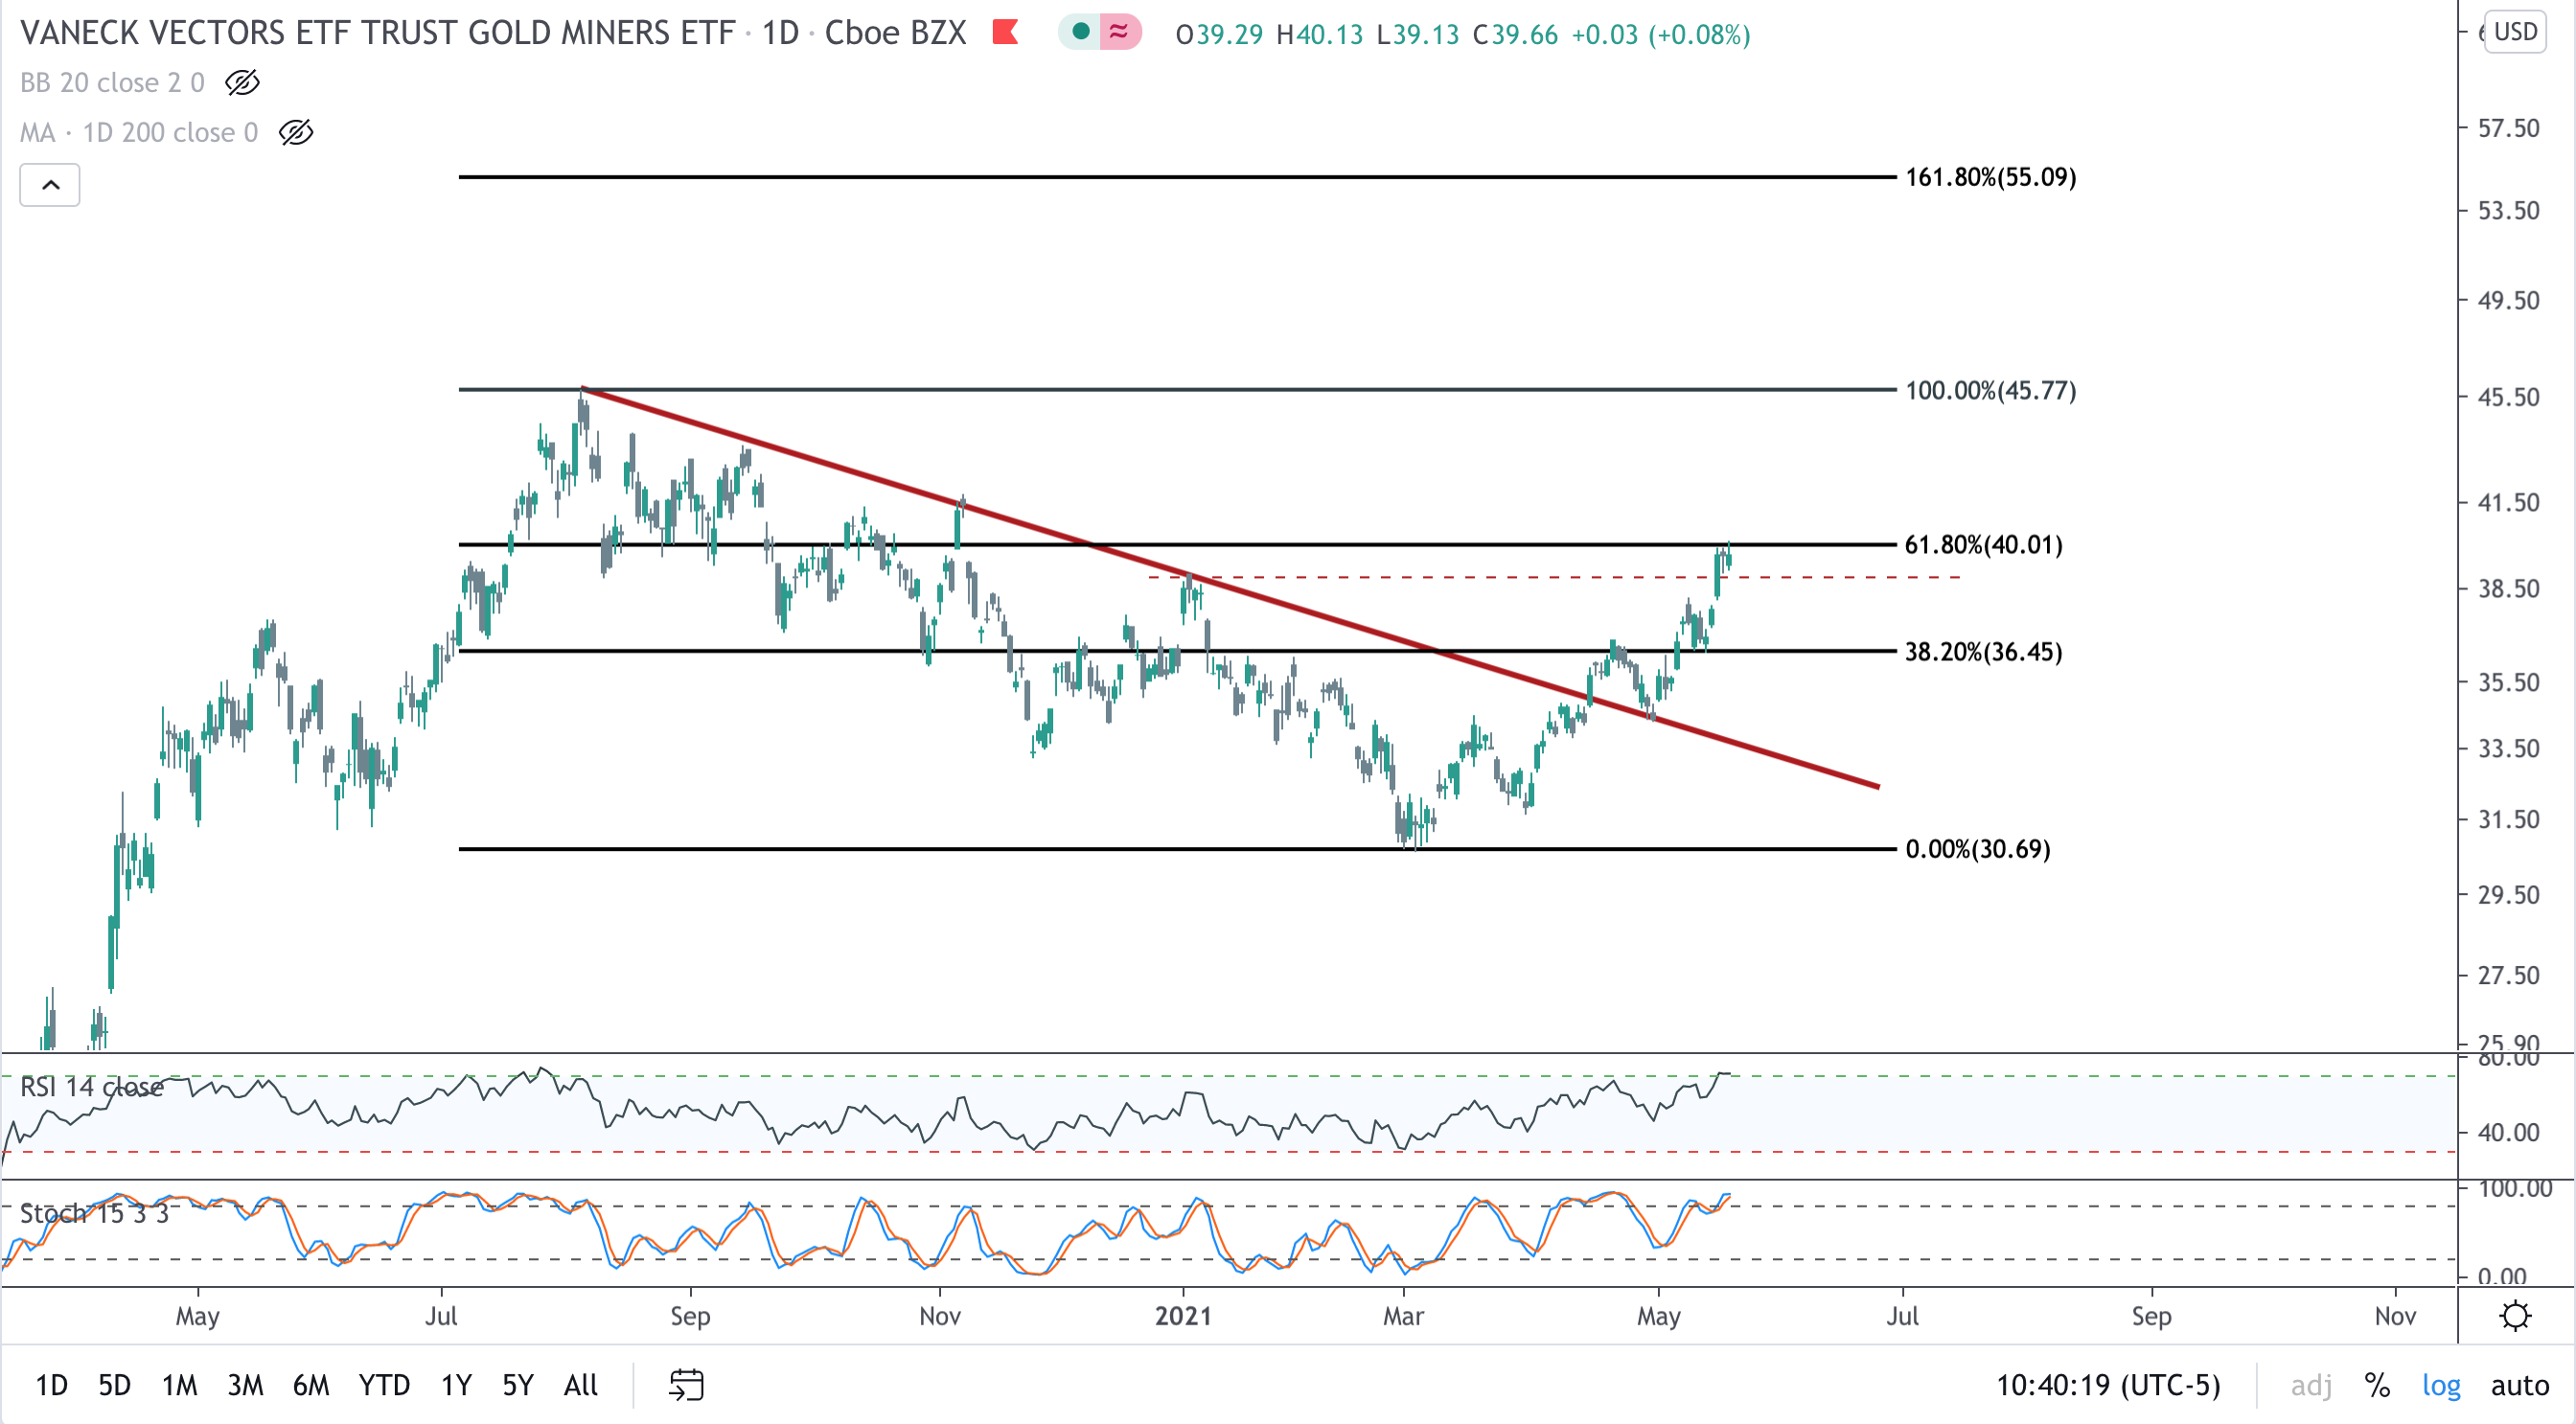
GDX, the Gold Miner ETF, broker falling resistance on the 4th test back on April 15th, successfully retested, and has pushed its way back to the 61.8 Fibonacci retracement from the August high. Constructively, price has never fallen into oversold territory from the entire move following the March 2020 low – even during this long consolidation period. We are likely to see some digestion of price at these levels, but a break of 40 should ignite a move to retest the August 2020 high at 45.85.
As always, we appreciate your feedback!
Related Posts