GOLD
Since mid-August, sales in the physical precious metals market – red hot at the peak of the COVID outbreak – have begun to taper off slightly. This slowing of demand is directly correlated to price action. I will focus on gold specifically. 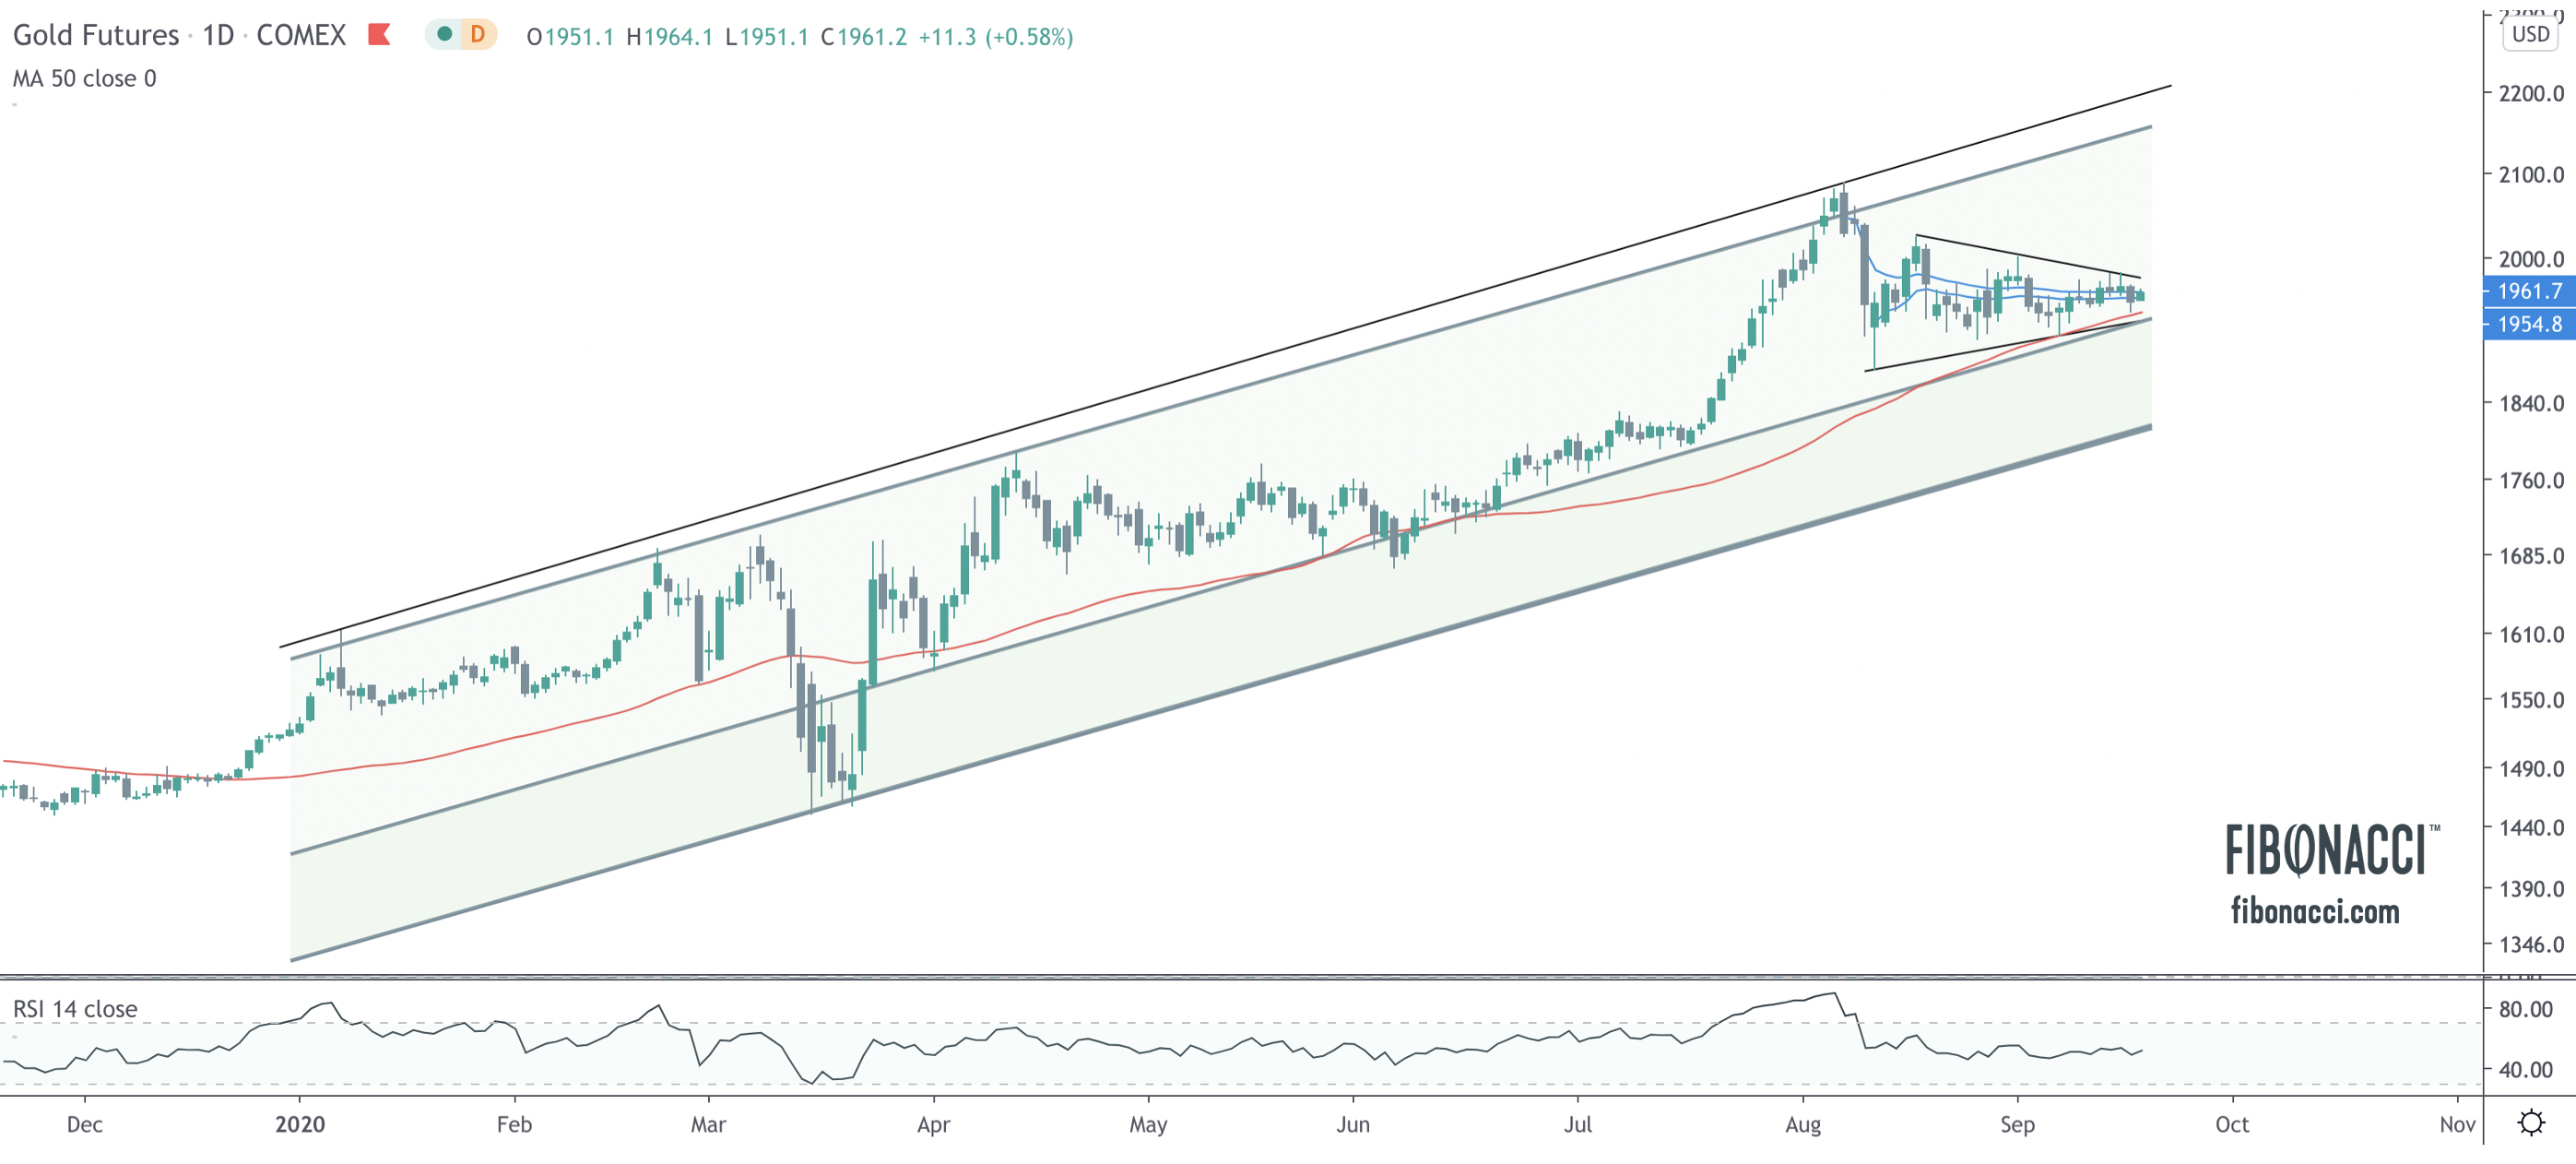
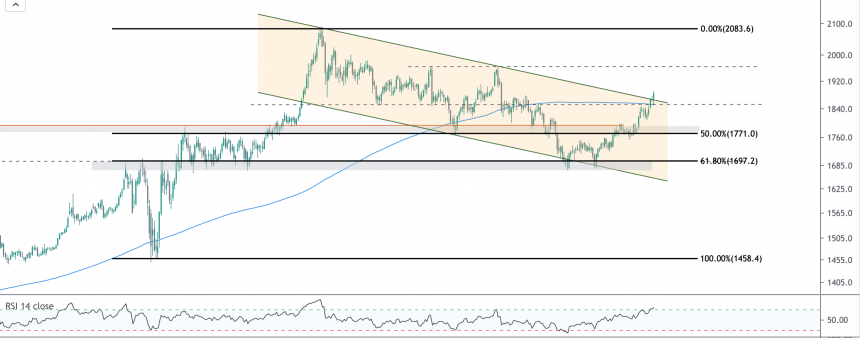
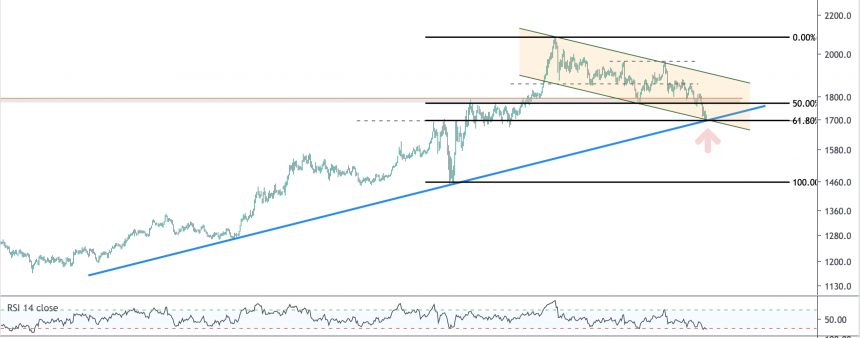
A closeup of the gold chart shows a narrowing and tightly wound price coil of lower highs and higher lows. This narrowing trading range has formed a symmetrical triangle (pennant formation) that probabilistically favors a move in the direction of the underlying trend (60/40). At present, the equilibrium in the market is notable: price is sandwiched between the anchored VWAP (volume-weighted average price) from the August high to the August low, slightly above the 50-day moving average. Price remains in the center of a price channel formed by the March high/low. Relative Strength (RSI) is static at 50, right in the middle of its range. Periods of tightening price equilibrium and consolidation are healthy in uptrending markets as the market digests new prices. As we approach the apex of this coil, gold appears to be setting up for a very big move.
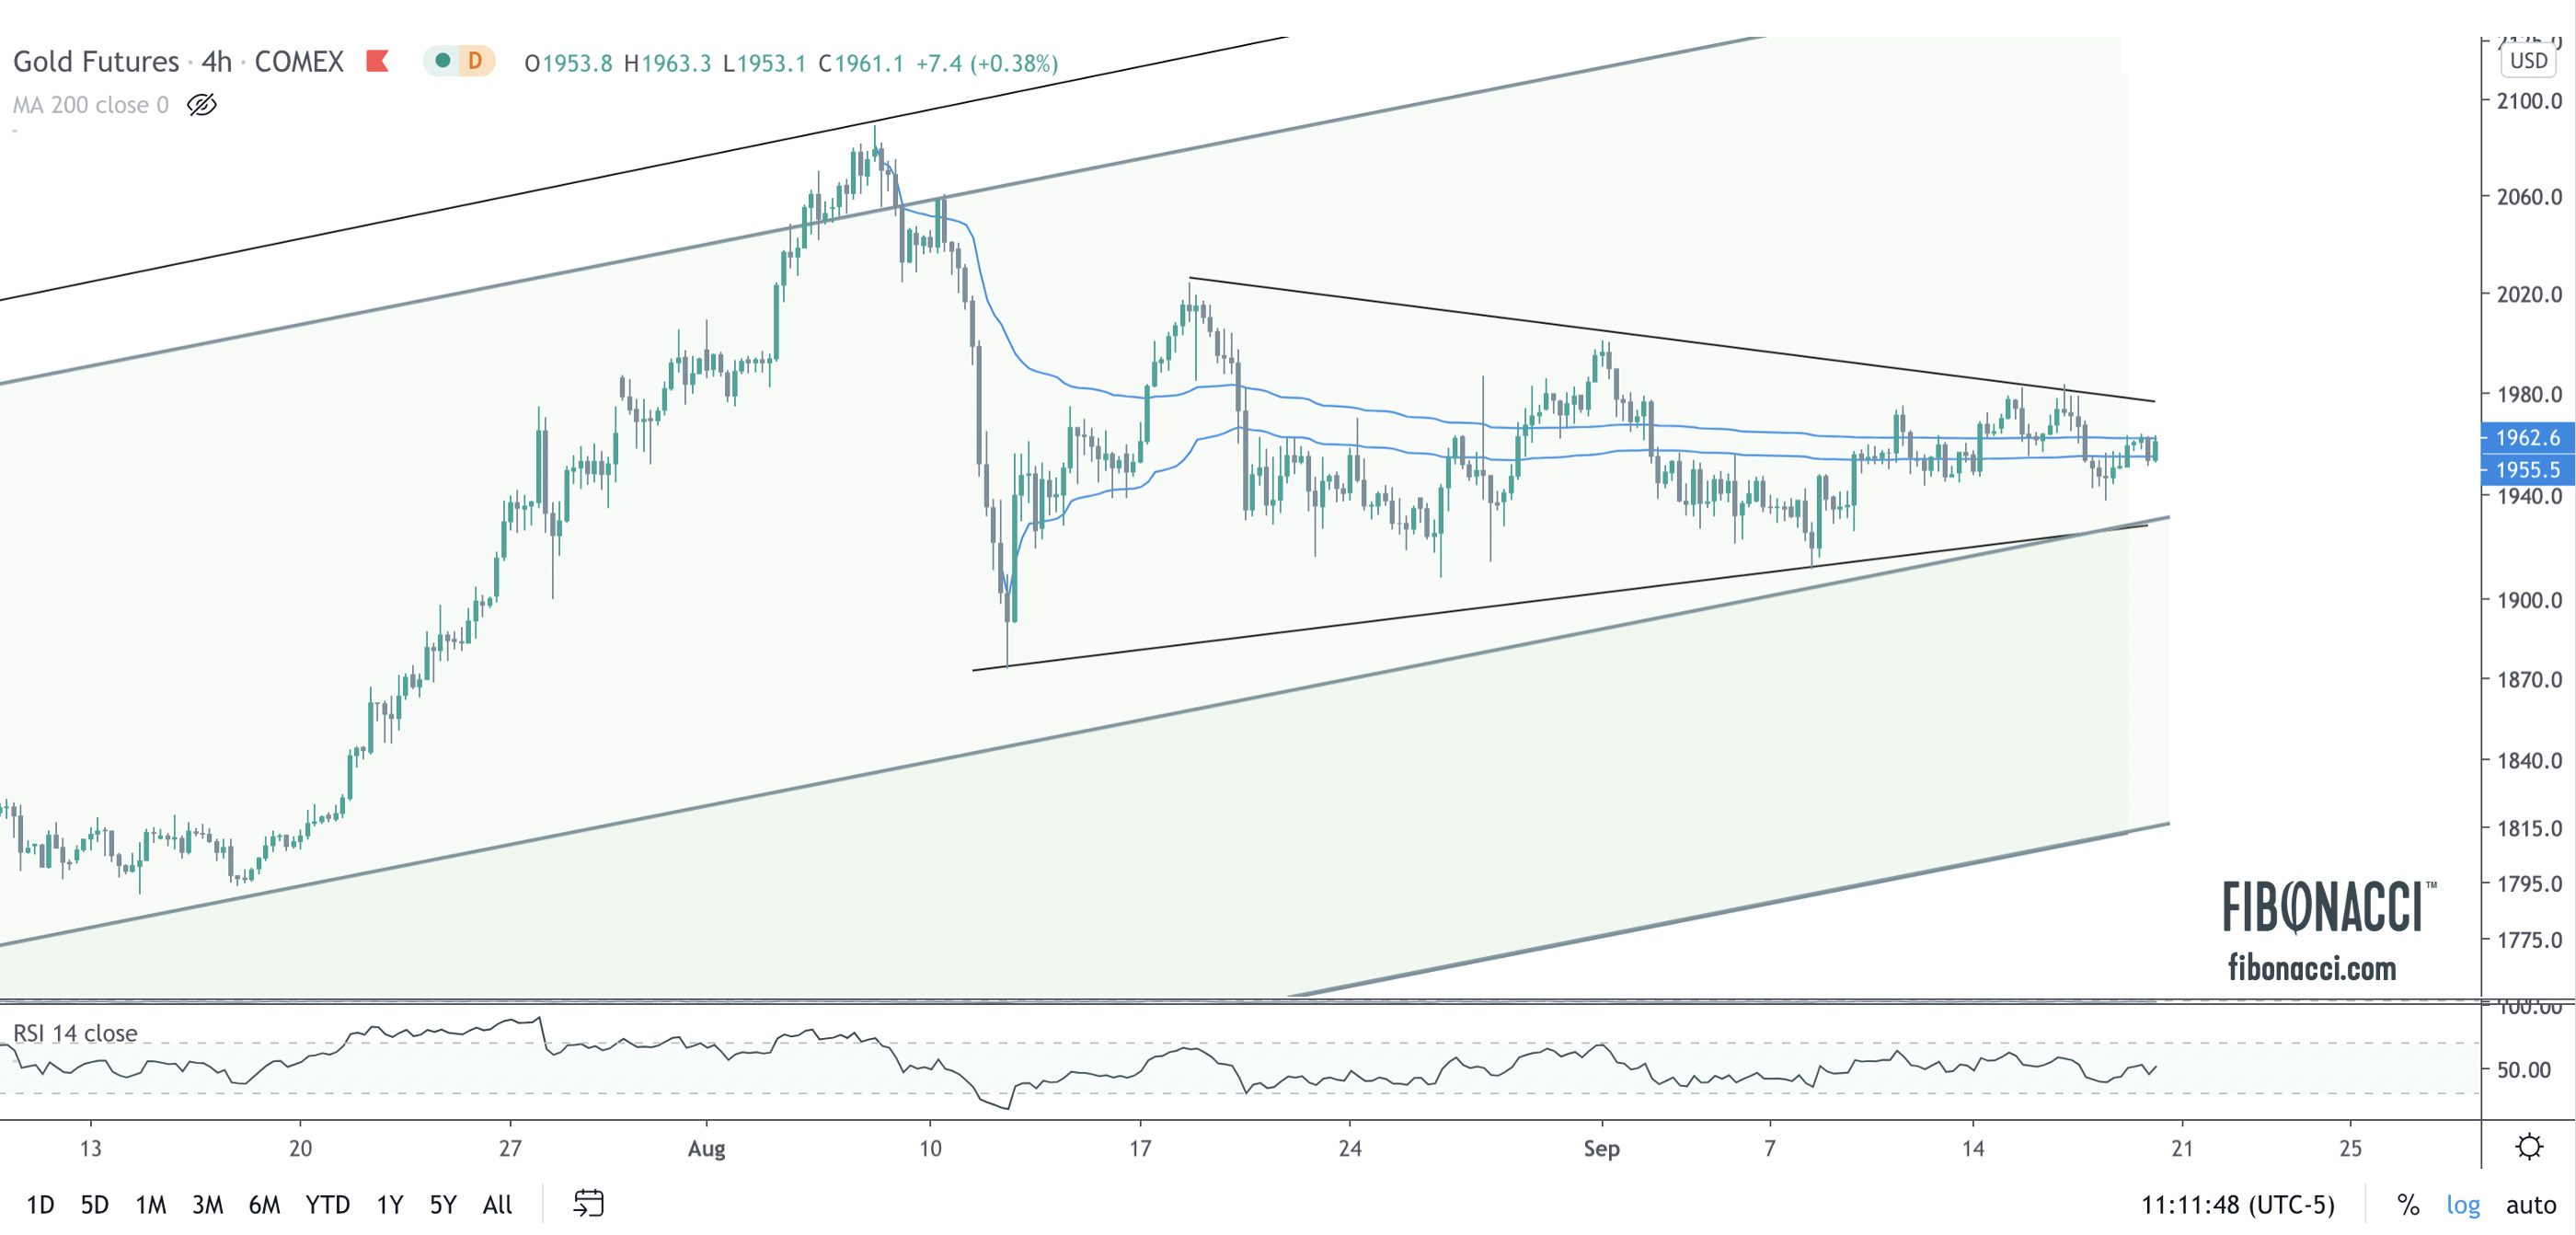
The downside risk remains on a break of $1930 to $1880, and then possibly a full retest of the breakout at $1800. At present, this looks less likely to me. Meanwhile, a breakout above $1980 would setup gold on a path to $2300. Resolution is coming soon – likely late September/early October.
Related Posts