The precious metals market is very clearly in a secular uptrend and prices look poised for further significant upside into the end of the year. My technical view is that in the short term prices have gotten a bit extended and that a pull back/consolidation is due (and healthy) to build the base for the next leg higher.
Gold
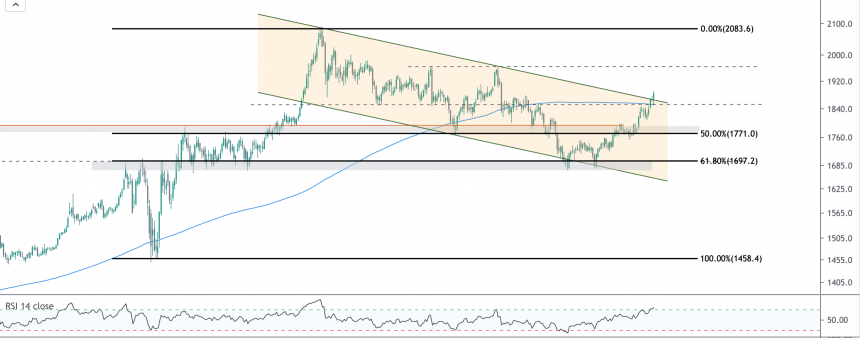
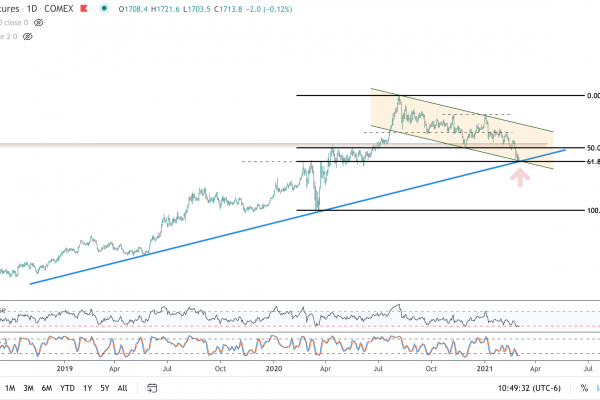
As I stated in my last post from July 8th: “I have always viewed the $1800 price level in gold as more significant than the $1910 blow-off top in 2011. The price level at $1800 was the multi-month, triple tested resistance level that precipitated the six-year base. If price holds, the breakout above this level is secular and very bullish.”
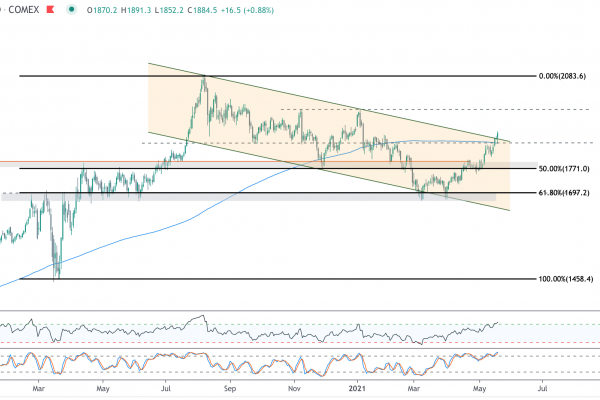
This past week December gold futures eclipsed $2000 and the front month August contract peaked just shy of the 127.2 Fibonacci extension. When this level breaks and holds, my text target is $2260 at the 161.8 Fibonacci extension. However, with the 14-period RSI in extreme overbought conditions, eclipsing 86 for the highest on record, and with bullish sentiment frothing, the timing seems ripe for a pullback (even if just a modest one).

For a more granular view, the August front month contract has been trading in this channel since February, and is also now approaching the upper bound. A logical place for a reentry to add to longs would be a small consolidation to rising support.

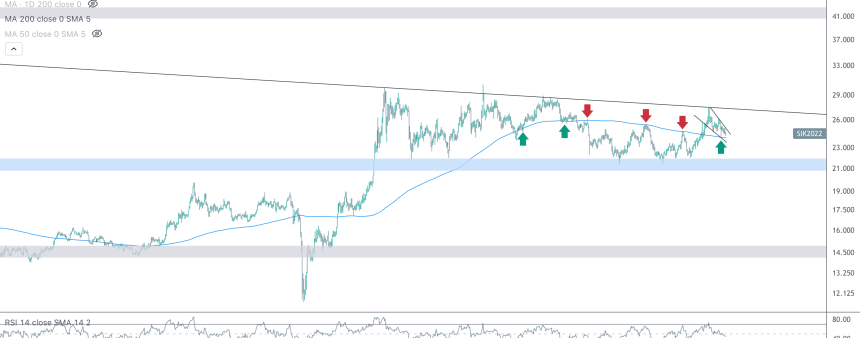
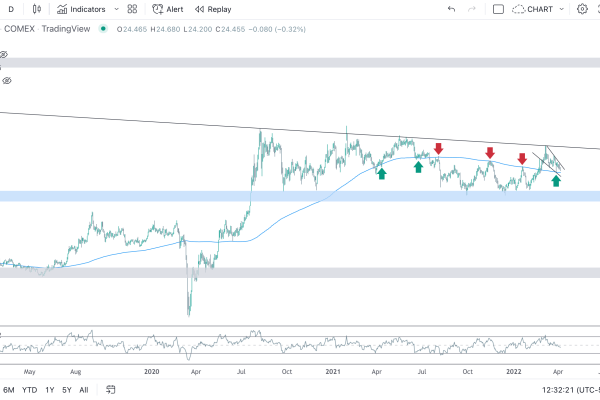
Silver
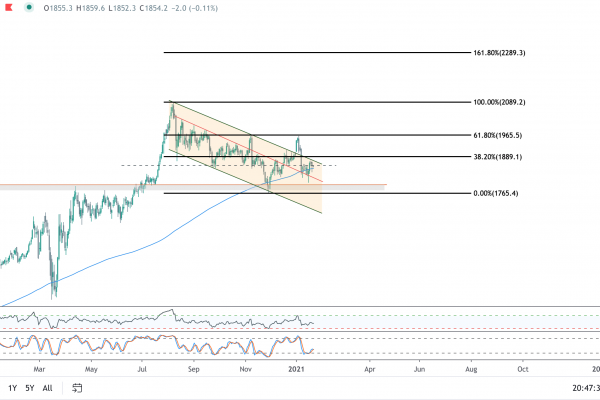
The level to watch in silver is $26 (the July high was 26.27). The $26 level was triple tested support in 2011-2012 and is now acting as resistance. This is also the 38.2 Fibonacci retracement from the peak in 2011 to the the 2015 low. The risk/reward favors a long position above $26 or on a retest of the $19.80 breakout level. Price could get choppy in between as the market digests the recent moves. When price breaks out above $26, the next key targets are $33 and $35 (the 61.8% Fibonacci retracement).

US Dollar
The US Dollar supports the metals thesis, acting as the inverse of metals price action. Big picture, in July, the US Dollar broke down from its 12-year rising channel (and diamond top pattern) and all technical indications look bearish.

However, in the short term, price is likely to push back to at least 94.60 as the dollar works off extreme oversold conditions and historic bearishness to retest prior support.

We are looking for further metals strength and dollar weakness as we head into the fall. As always, we welcome any feedback and comments.
Related Posts