
25.6% below the all-time high of $5,405.00 (Jan 2026)
As of 4:56 AM ET on October 26, 2026, the spot price of gold is $4,021.45 per troy ounce, $129.29 per gram and $129,293 per kilogram, up 0.20% from the last LBMA PM fix. Daily brief →
Gold price per gram, ounce and kilo
Spot converted to the weight units used by jewelers, refiners and international markets. Retail prices add a premium.
| Unit | Grams | Gold price |
|---|---|---|
| Troy ounce ozt | 31.103 | $4,021.45 |
| Gram g | 1 | $129.29 |
| Kilogram kg | 1,000 | $129,293 |
| Pennyweight dwt | 1.555 | $201.07 |
| Tola tola | 11.664 | $1,508.04 |
| Ounce (avdp) oz | 28.35 | $3,665.38 |
Gold price by karat
What the gold content of jewelry is worth at each karat. Scrap buyers pay 85–95% of these figures.
| Purity | Fine | Per gram | Per troy oz |
|---|---|---|---|
| 24Kfine gold, bullion coins and bars | 99.9% | $129.16 | $4,017.43 |
| 22KGold Eagles, Krugerrands, Indian jewelry | 91.6% | $118.43 | $3,683.65 |
| 18Kfine jewelry | 75.0% | $96.97 | $3,016.09 |
| 14Kmost US jewelry | 58.5% | $75.64 | $2,352.55 |
| 10Kminimum karat sold as gold in the US | 41.7% | $53.92 | $1,676.94 |
| 9KUK and Australian jewelry | 37.5% | $48.48 | $1,508.04 |
Best value gold at Texas Precious Metals
Compare all → Austrian Gold Philharmonic Coin $4,090.40/ oz of gold Best value
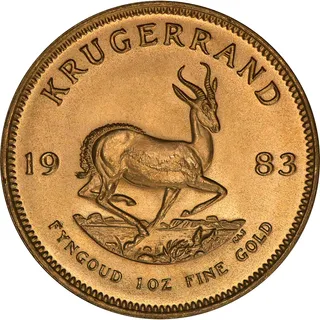 South African Gold Krugerrand $4,101.39/ oz of gold +$10.99/oz vs best
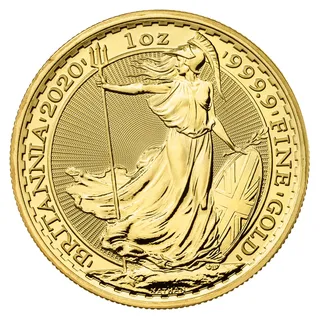 Royal Mint Gold Britannias $4,121.40/ oz of gold +$31.00/oz vs best
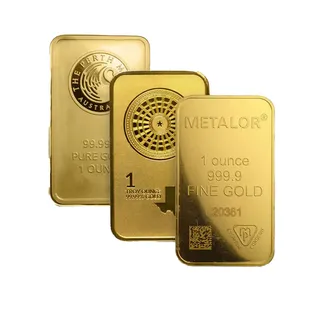 1 oz Gold Bars $4,141.40/ oz of gold +$51.00/oz vs best
Price per ounce of pure metal at Texas Precious Metals (ACH/wire price), 4:54 AM ET.
Silver, platinum and palladium prices
Market news
View all →
Gold Risks a Near-Term Drop, What ZeroHedge Says and How Investors Might React
Discover how silver can hedge gold-heavy portfolios during the anticipated short-term gold crash, with historic data, volatility insight, and actionable steps.
Rising Home Insurance Costs: A Factor to Watch for Gold and Silver Trends
Discover how soaring homeowner insurance costs drive real-rate shifts, USD depreciation and boost gold and silver prices for investors.
Hidden Debt-Dollar Gold Link: Why Rising U.S. Borrowing Is Quietly Slowing Gold’s Rally
Explore how the exploding U.S. federal debt weakens the dollar, drags down gold prices, and introduces a new Debt-Dollar Safety-Net Index for investors.
Japan’s Fuel Subsidy Cuts: How Real-Rate Shifts Could Push the Gold Premium Higher
Japan’s fuel subsidy cuts could lift real rates, strengthen the dollar and boost the gold premium, essential insights for precious-metal investors.
What is the gold spot price?
GoldPrice.com tracks the live gold price in US dollars per troy ounce, refreshed every 60 seconds from institutional market feeds. The headline figure is the spot price — the wholesale price for immediate delivery of a 400 oz London Good Delivery bar — which every dealer, refiner and jeweler works from.
Retail prices differ from spot in both directions: dealers sell coins and bars at a premium above it and buy back slightly below it, and scrap buyers pay a percentage of the melt value derived from it. The per-gram and karat tables below translate spot into the numbers you actually meet in a shop or a refinery.
Every figure on this page is timestamped and attributed. Spot and per-unit prices come from Metals.dev, dealer bid and ask from Texas Precious Metals, and history from daily LBMA fixes back to 1968.
How has the gold price changed over time?
Our gold price history and interactive charts draw on daily LBMA closing prices back to 1968 for gold and silver, and to 1990 for platinum and palladium. Compare today’s price with the all-time high, zoom from one month to the full series, or see what a past purchase is worth with the investment growth calculator.
How much is my gold worth?
The scrap gold calculator gives melt value by karat and weight; the coin and bar calculator values Eagles, Maple Leafs and bars by fine content; the portfolio calculator tracks everything you hold at live spot. All eleven tools use the same prices shown on this page.
Gold calculators
Gold price questions
What is the price of gold today?
The live spot price is shown at the top of this page in US dollars per troy ounce, with its change since the last LBMA PM fix and the time it was last updated. It refreshes about once a minute during market hours.
How much is gold per gram?
Divide the spot price per troy ounce by 31.1035. The per-gram table on this page does that live, and the karat table adjusts it for 22K, 18K, 14K and 10K purity.
Why is the price I’m quoted different from spot?
Spot is a wholesale reference. Dealers add a premium when they sell (covering minting, shipping and margin) and deduct a discount when they buy back. Scrap buyers typically pay 85–95% of melt value.
What moves the gold price?
Real interest rates and the US dollar most of all, then central-bank buying, inflation expectations, geopolitical risk and investment flows into ETFs. Jewelry and industrial demand set a floor over the long run.
What is the all-time high gold price?
The record close is shown beneath the live price with its date, and the history pages and charts let you see how far the current price sits from it.
Is gold a good investment right now?
GoldPrice.com does not give investment advice. What we can show is the data: the live price, the ratio to silver, the distance from the all-time high, and what any past purchase would be worth today via the investment growth calculator.
Spot prices are aggregated from global exchange and OTC feeds via Metals.dev; dealer bid and ask quotes are supplied by Texas Precious Metals; cryptocurrency prices by CoinGecko. Prices are indicative market data, not an offer to buy or sell, and nothing on this site is investment advice.