Given the extreme recent demand in the precious metals markets, this is the first opportunity I have had to reflect on the charts. For those interested in my thoughts on rising premiums and the cause for falling spot metal prices in early March, please refer to the articles linked.
The sell off in markets accelerated by coronavirus and the global reaction to curtail the pandemic has left no prisoners, as nearly all asset classes are selling off in a flight to liquidity. As large institutions face margin calls, they are forced to close positions or raise cash by selling anything and everything that is liquid. Gold and silver – the “safe haven” assets – are no exception. I would remind readers that in the global financial crisis gold fell 27% and silver fell 55% in nominal terms. Gold outperformed equities on a relative basis, but silver actually underperformed.
Fear or Greed?
The last two weeks have been extremely volatile in the markets, and for the first time in a long time my friends and family have called to inquire about “what is going on in the markets?” Coronavirus contagion fears, coinciding with all-time highs in the markets, has been the scapegoat for a rapid, deflationary decline across nearly all markets except bonds, which resiliently continued to fetch a bid. Even the US Dollar, traditionally a safe haven in deflationary swoons, declined.
Gold Breaks Out; Silver Gearing Up for a Move
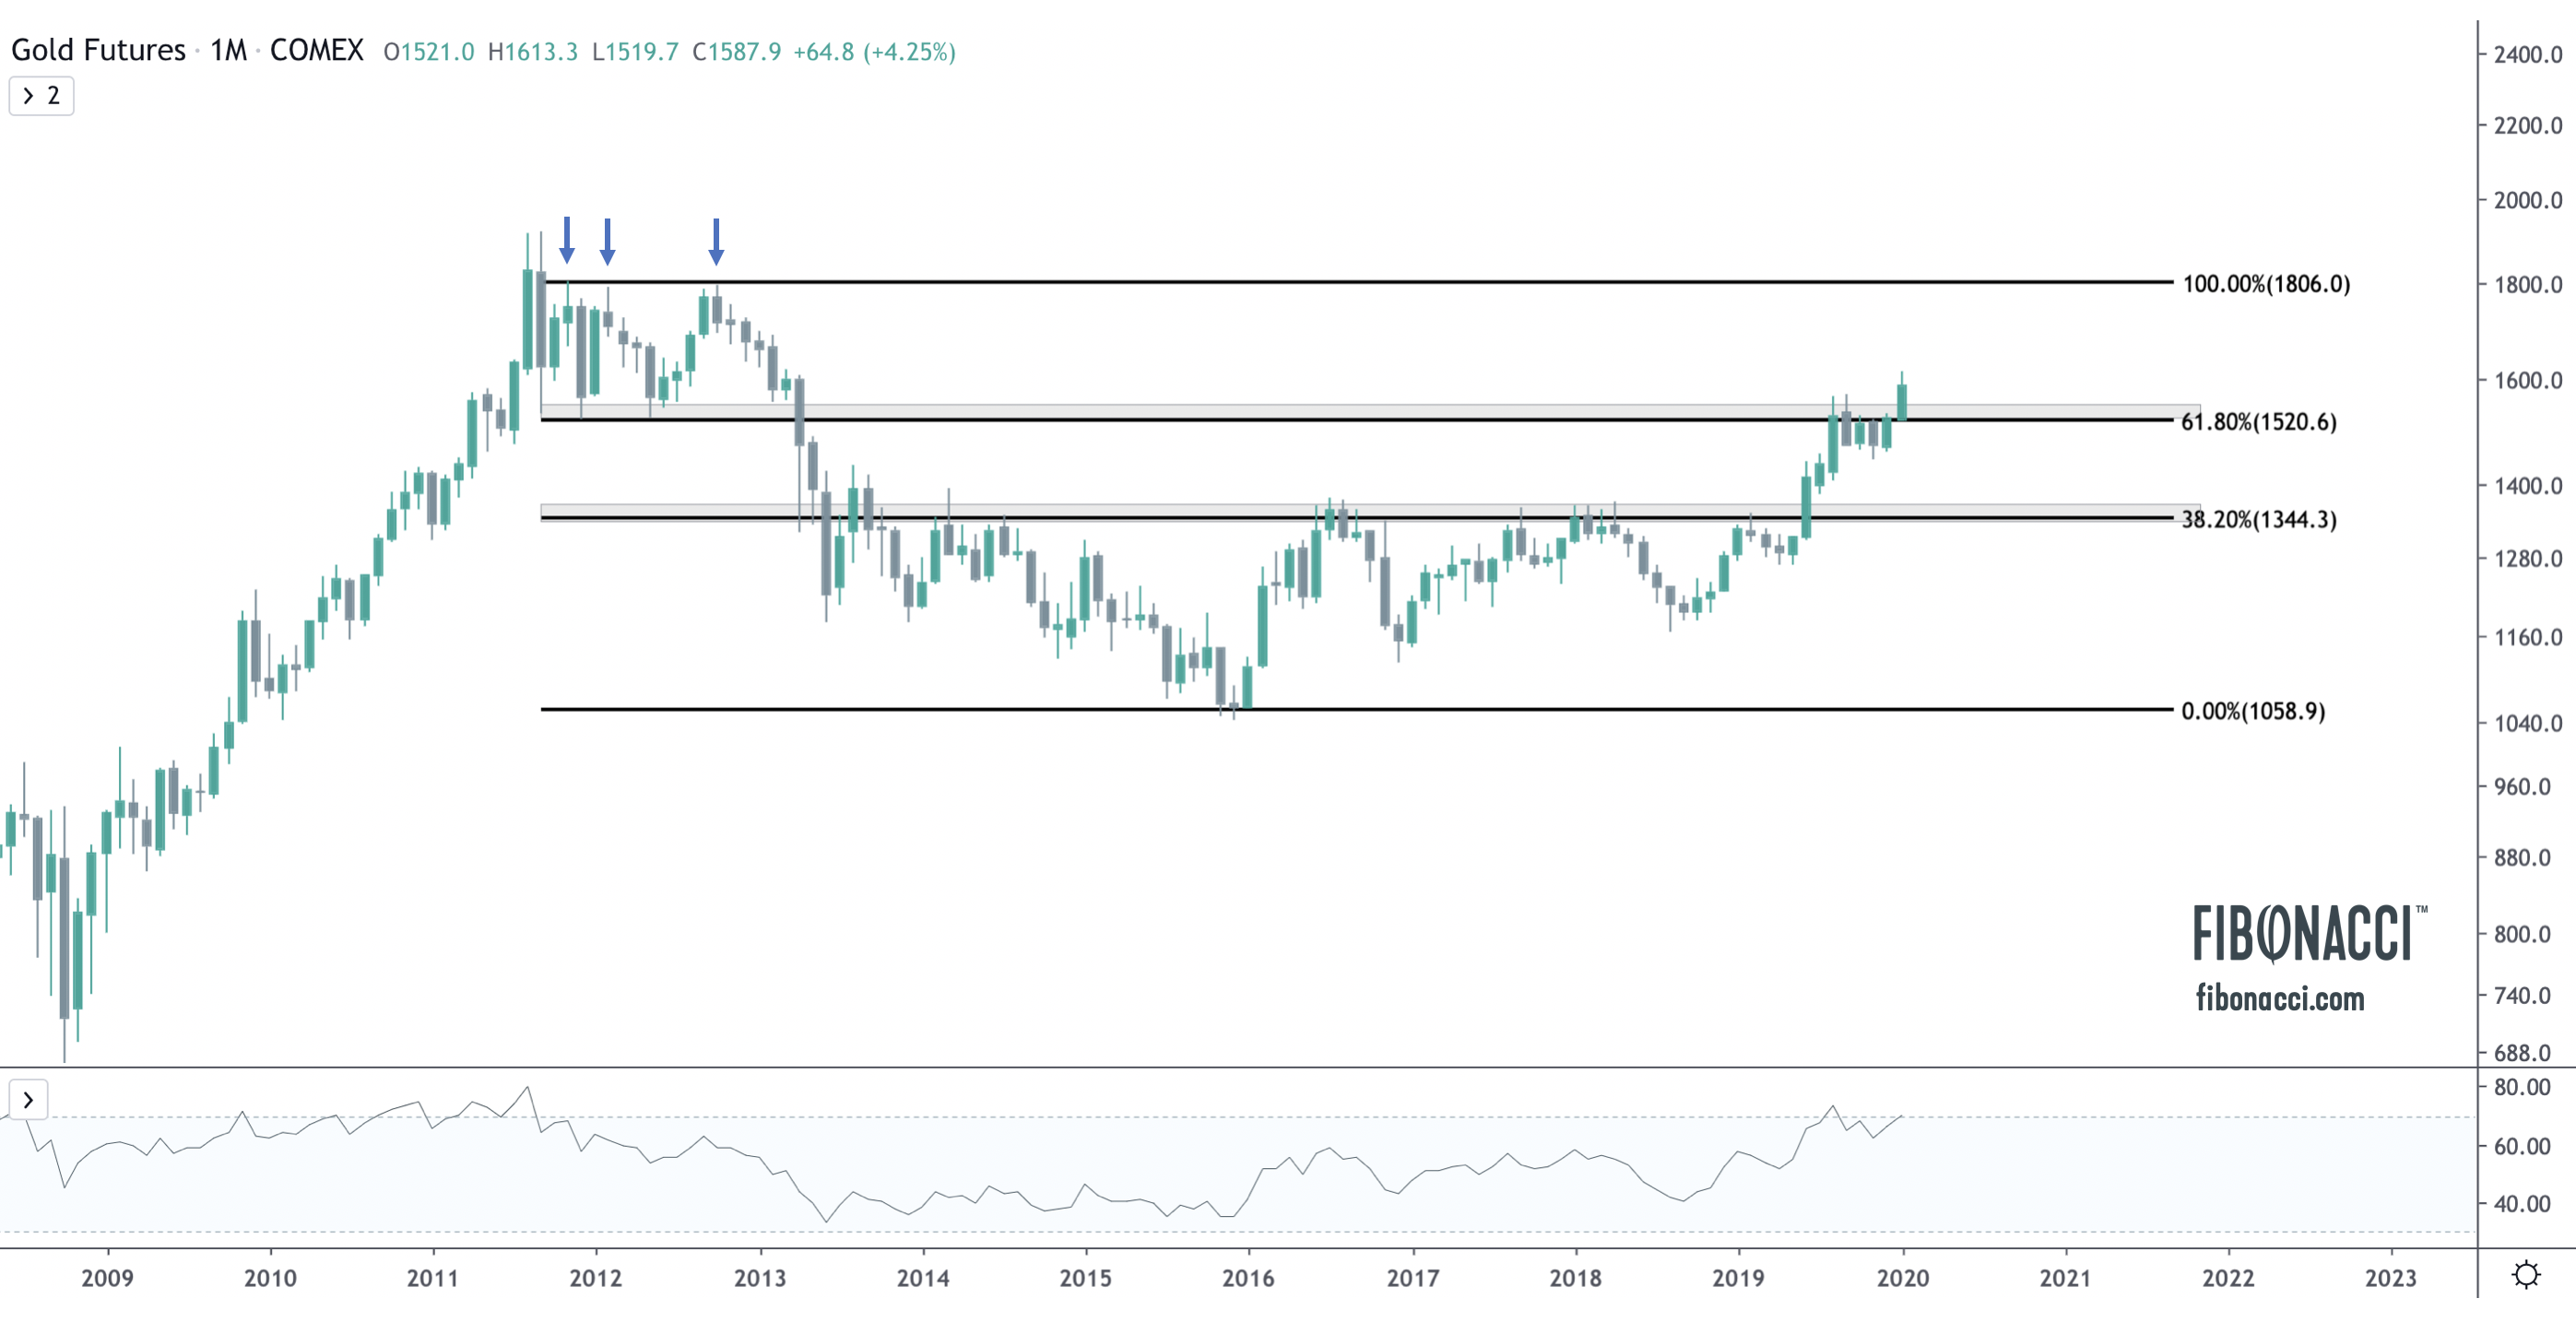
Gold bugs should be pleased with the monthly performance of gold in January. The definitive monthly break of the $1520 level, which had acted as strong monthly support six times between 2011-2013, before serving as resistance during this recent consolidation period between August and December, has sent a bullish longer term signal to the market.
Bullish Tailwinds in US Housing
In this video, I review key technicals in the US housing market, specifically the real estate ETF REZ, home construction ETF ITB, mortgage rates and lumber. I also explore some key demographic trends that could help fuel the rise in the US housing market.
As always, I hope this is helpful, and I welcome any feedback or questions.
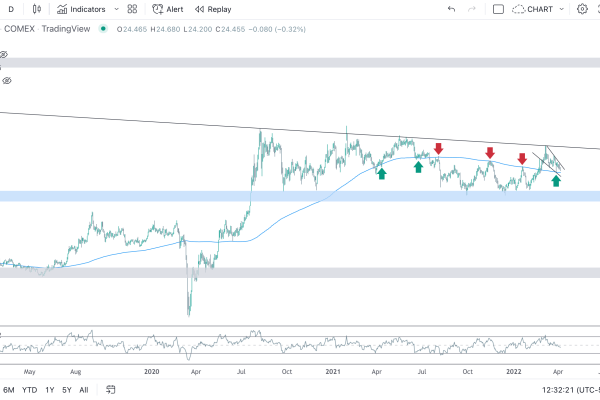
Silver Testing Key Level
Dollar Movement Will be Key in 2020
Energy
Precious Metals
Currencies
Fixed Income
Equities
Price Prepping for New 7-Yr Highs?
Happy New Year! We are kicking off the New Year with stocks at all-time highs, oil prices spiking on Middle East tensions, and the precious metals complex following through nicely for our November/December videos. If you haven’t had a chance to watch those videos, they offer a helpful background on the technical setup for metals and the price action we are seeing today.
Which Asset Class Will Outperform?
In advance of tomorrow’s Fed meeting and decision on interest rates, I am closely monitoring the S&P500 priced in gold. The S&P500 has broken out to all-time highs and has successfully retested the breakout, while gold has retreated ~$100 from its highs in August, either setting up a washout to a new near term bottom (possibly backtesting the entire breakout from $1380), or preparing for a rally to retest the $1580 level after a multi-month bull flag.
Mining Stocks Leading Gold Higher?
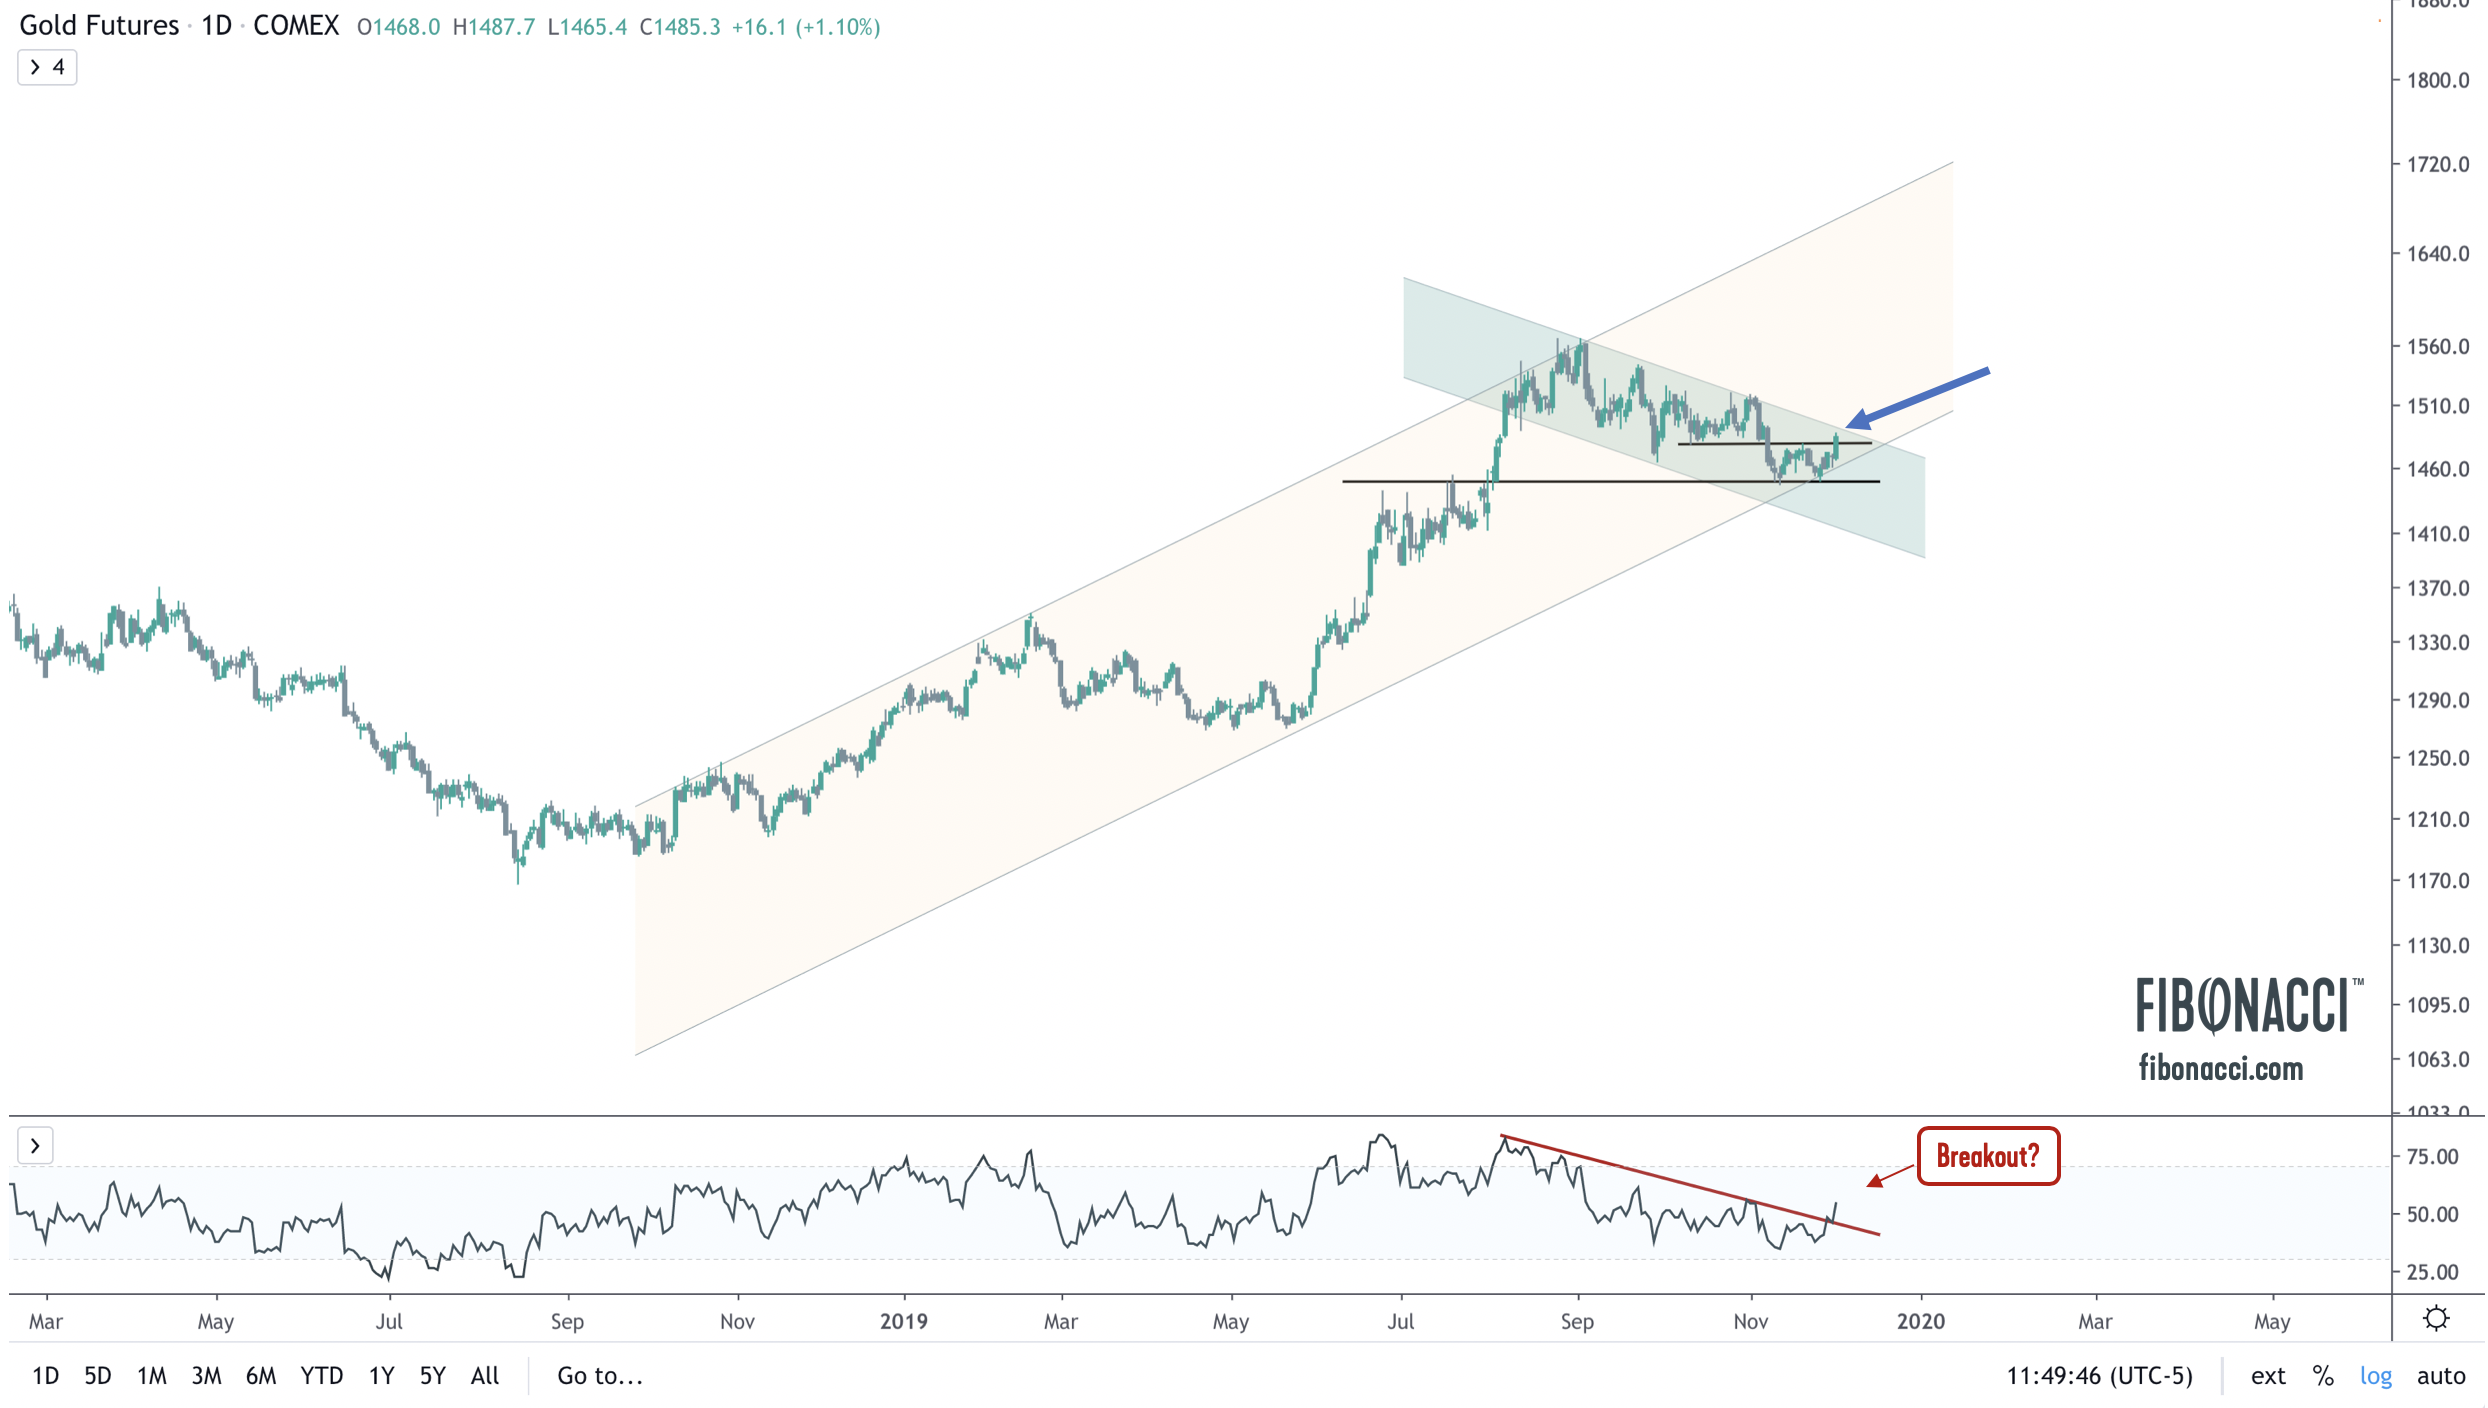
I produced this video on the gold and silver mining sector last night, and as of this morning gold is up significantly and all of the mining stocks continue to follow through. Gold (see chart above) just broke above horizontal resistance and is now looking to break up from the August downtrend channel. A move above $1495 would resume the uptrend from 4Q18, where channel support recently held. As presented in early November, I continue to believe this is a Wave 4 of 5, and that we will retest the highs at $1560-$1580. A close above $1495 would confirm it.
$GDX $GDXJ $ABX $NEM $XME $WPM $GOLD.V
Gold, Silver, Platinum, Palladium, and Copper
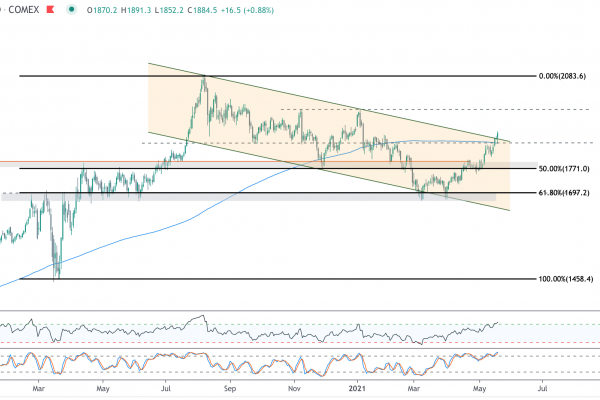
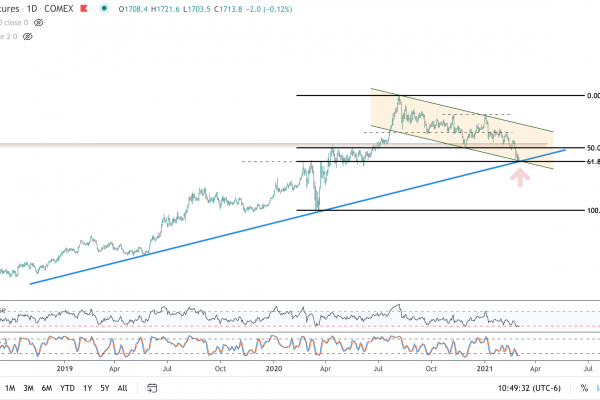
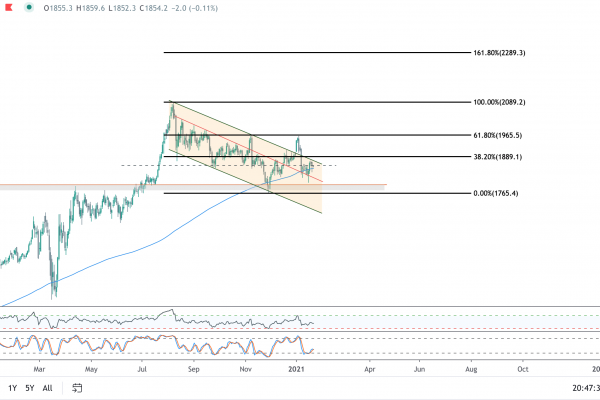
In this week’s video I take a look at the charts of gold, silver, platinum, palladium, and copper and offer some thoughts on where I see prices moving next. In the case of gold, which has enjoyed a fantastic run-up from $1180 to $1570 this year (in the process breaking out of a six year base), price is pulling back and bull flagging at the 61.8% Fibonacci retracement. Does it make a push down to $1400 to backtest the entire move? Will silver find support at $16.60 or are we moving lower? Will palladium continue its historic march hire, or will it meet resistance at future levels?
I discuss all this and more in today’s ten minute video. As always, whether you agree or disagree with my analysis, I would love to hear your feedback.