Given the extreme recent demand in the precious metals markets, this is the first opportunity I have had to reflect on the charts. For those interested in my thoughts on rising premiums and the cause for falling spot metal prices in early March, please refer to the articles linked.
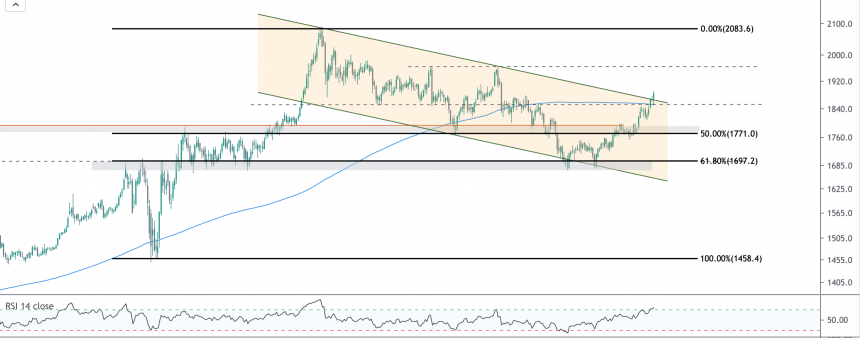
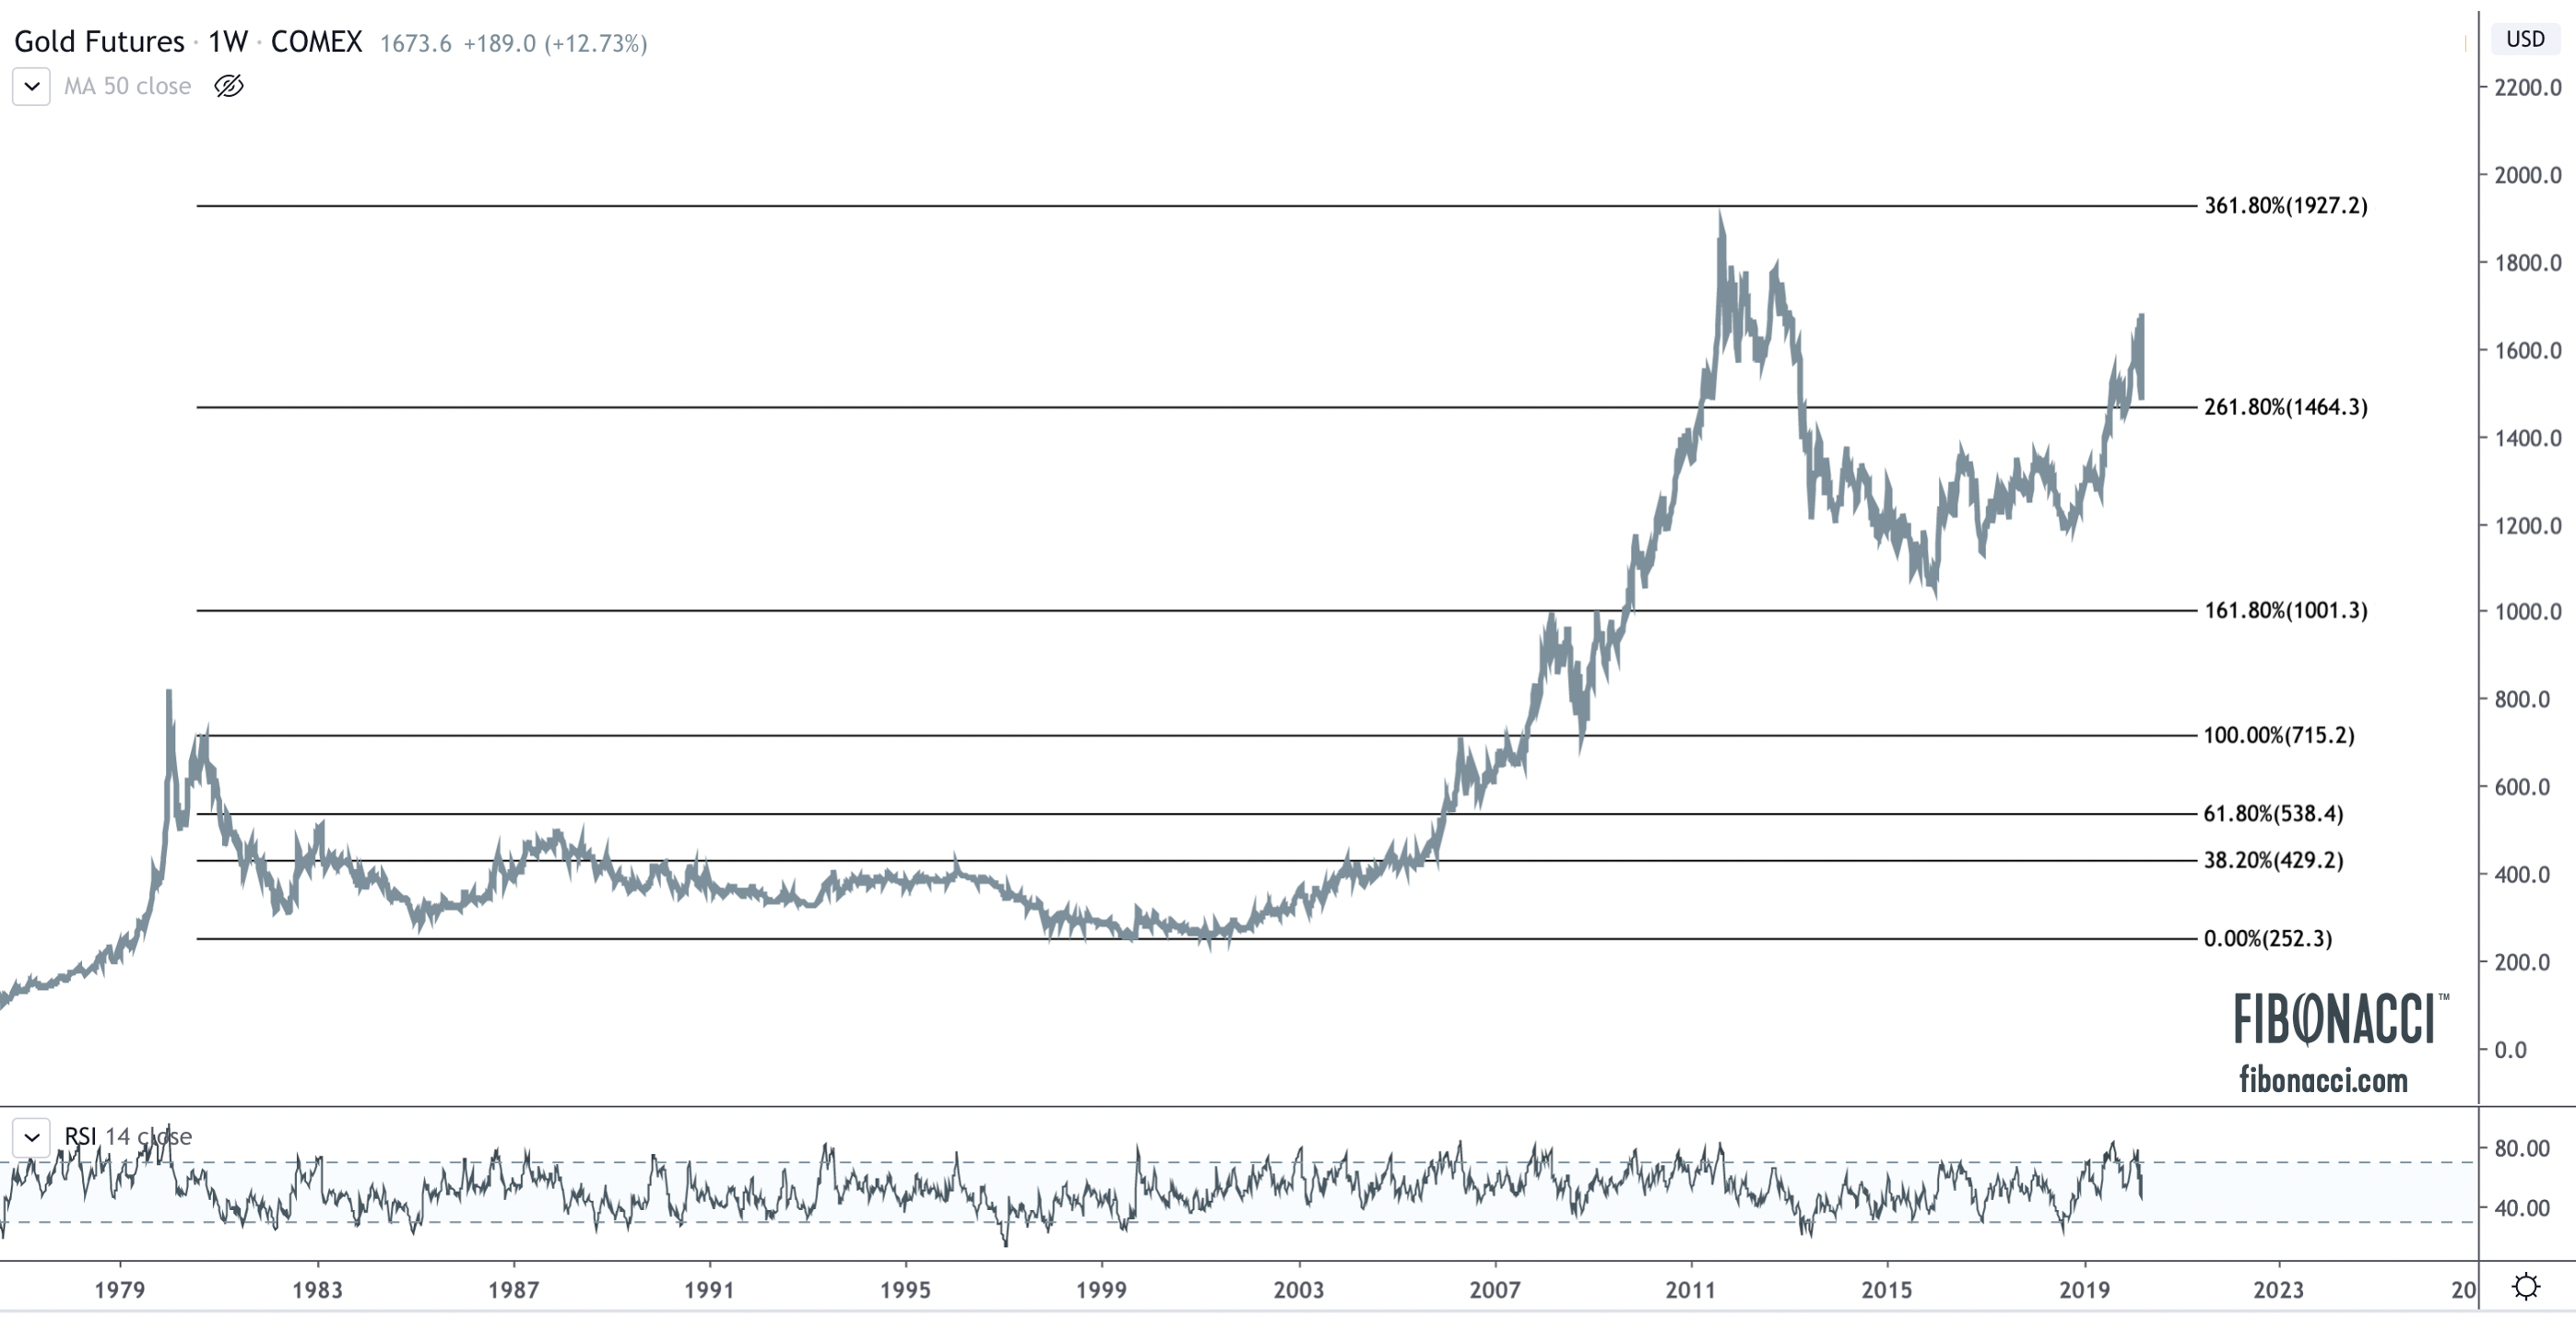
I want to review price action in gold. Below is the long term, 40-year semi-log chart of gold weekly futures. I have drawn my fibonacci levels from the secondary high in 1980 ($720) to the bottom in 2001 ($250). The story is as follows:
- Following a 20-year bear market, gold began its bull market after 9/11, with price finally retesting the secondary high at $720 before a pullback to the 61.8% Fibonacci retracement.
- Support held there, and a second leg to a new all-time high at $1030 (161.8% extension) commenced before a retest of the $720 level at the 2008 bottom of the Great Financial Crisis (formerly resistance, now support).
- The subsequent bull move took gold to new all-time highs at $1910, stopping perfectly at the 361.8% fibonacci extension.
- The ensuing bear market backtested all the way to the prior peak at $1030 (161.8 extension) before finally breaking above the 261.8 extension in August of 2019.
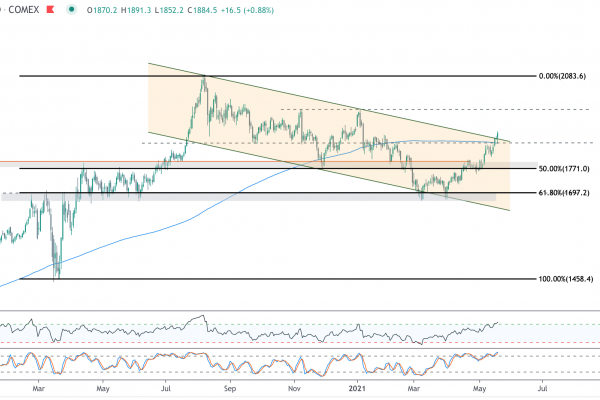
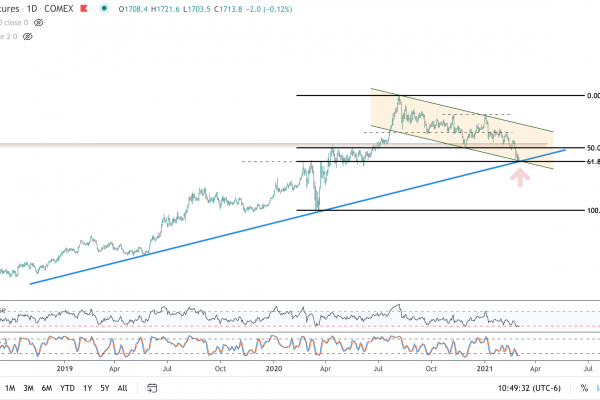
- Since August, gold has peaked at $1700, and the recent liquidity driven sell-off has simply backtested the breakout at $1450 (261.8 extension), where we have seen a powerful and historic rally this week of over $250 in two days.
Gold recently recaptured prior support in the mid $1500s, which it had briefly lost. This was important. If gold can hold the $1450 level, the next logical push would be to retest the all-time highs at $1910. A break from there would target the 461.8 extension at $2400 (measured from 1980 peak to 2001 trough), which also coincides with the 161.8 extension from the August ’11 peak to the December ’15 low.
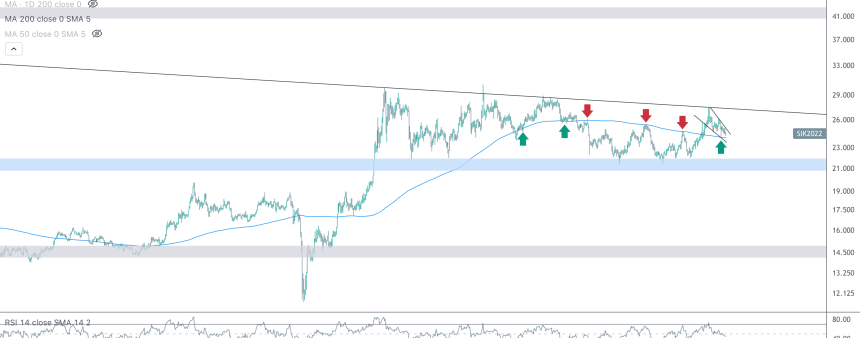
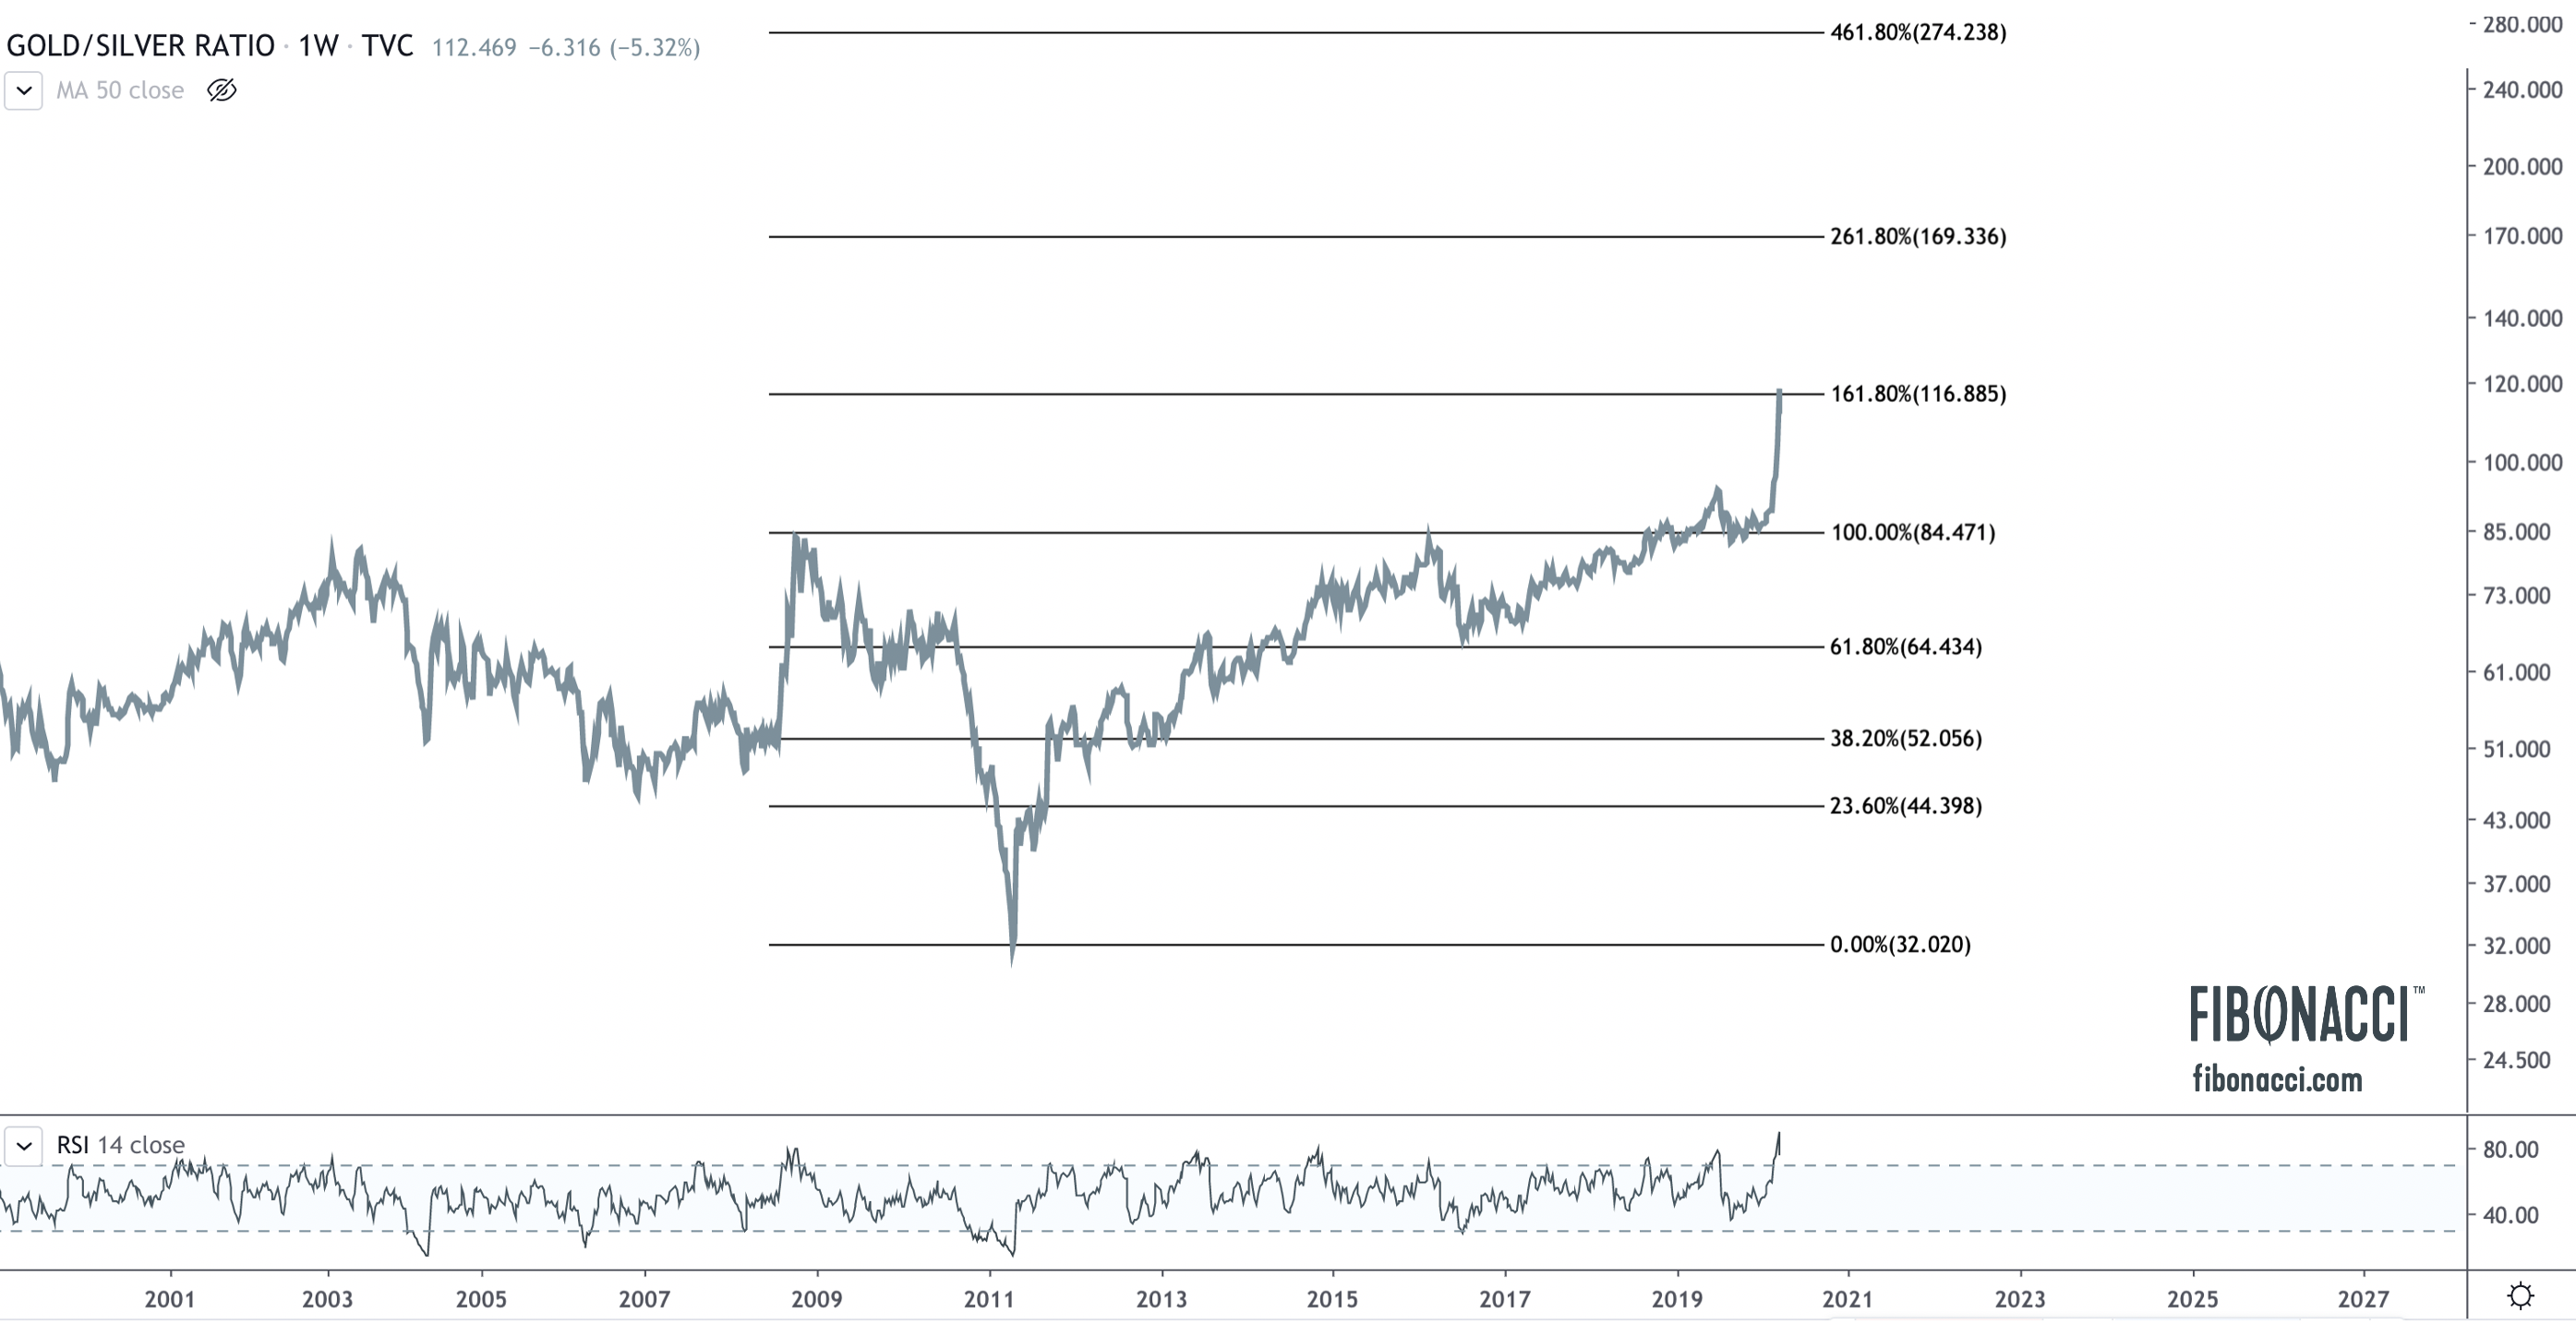
Silver has been the laggard relative to the gold price (very common in liquidity driven sell-offs), and last week the gold:silver ratio hit an all-time high of 117/118, which coincides perfectly with the 161.8 Fibonacci extension from the 2008 peak (gold outperforming) to the 2011 trough (silver outperforming). The ratio peaked at a weekly RSI reading of 92 (!), which is an all-time high, and further supports the expectation of a likely pullback. As of this writing, the ratio stands at 111, and it would appear there is more downside to come (near term silver outperformance).
As always, we look forward to your feedback. Be safe out there!
Related Posts