The precious metals sector has continued the momentum it closed with in May. Gold and silver, in particular have been surging this first trading day in June. Let’s take a look at the technicals.
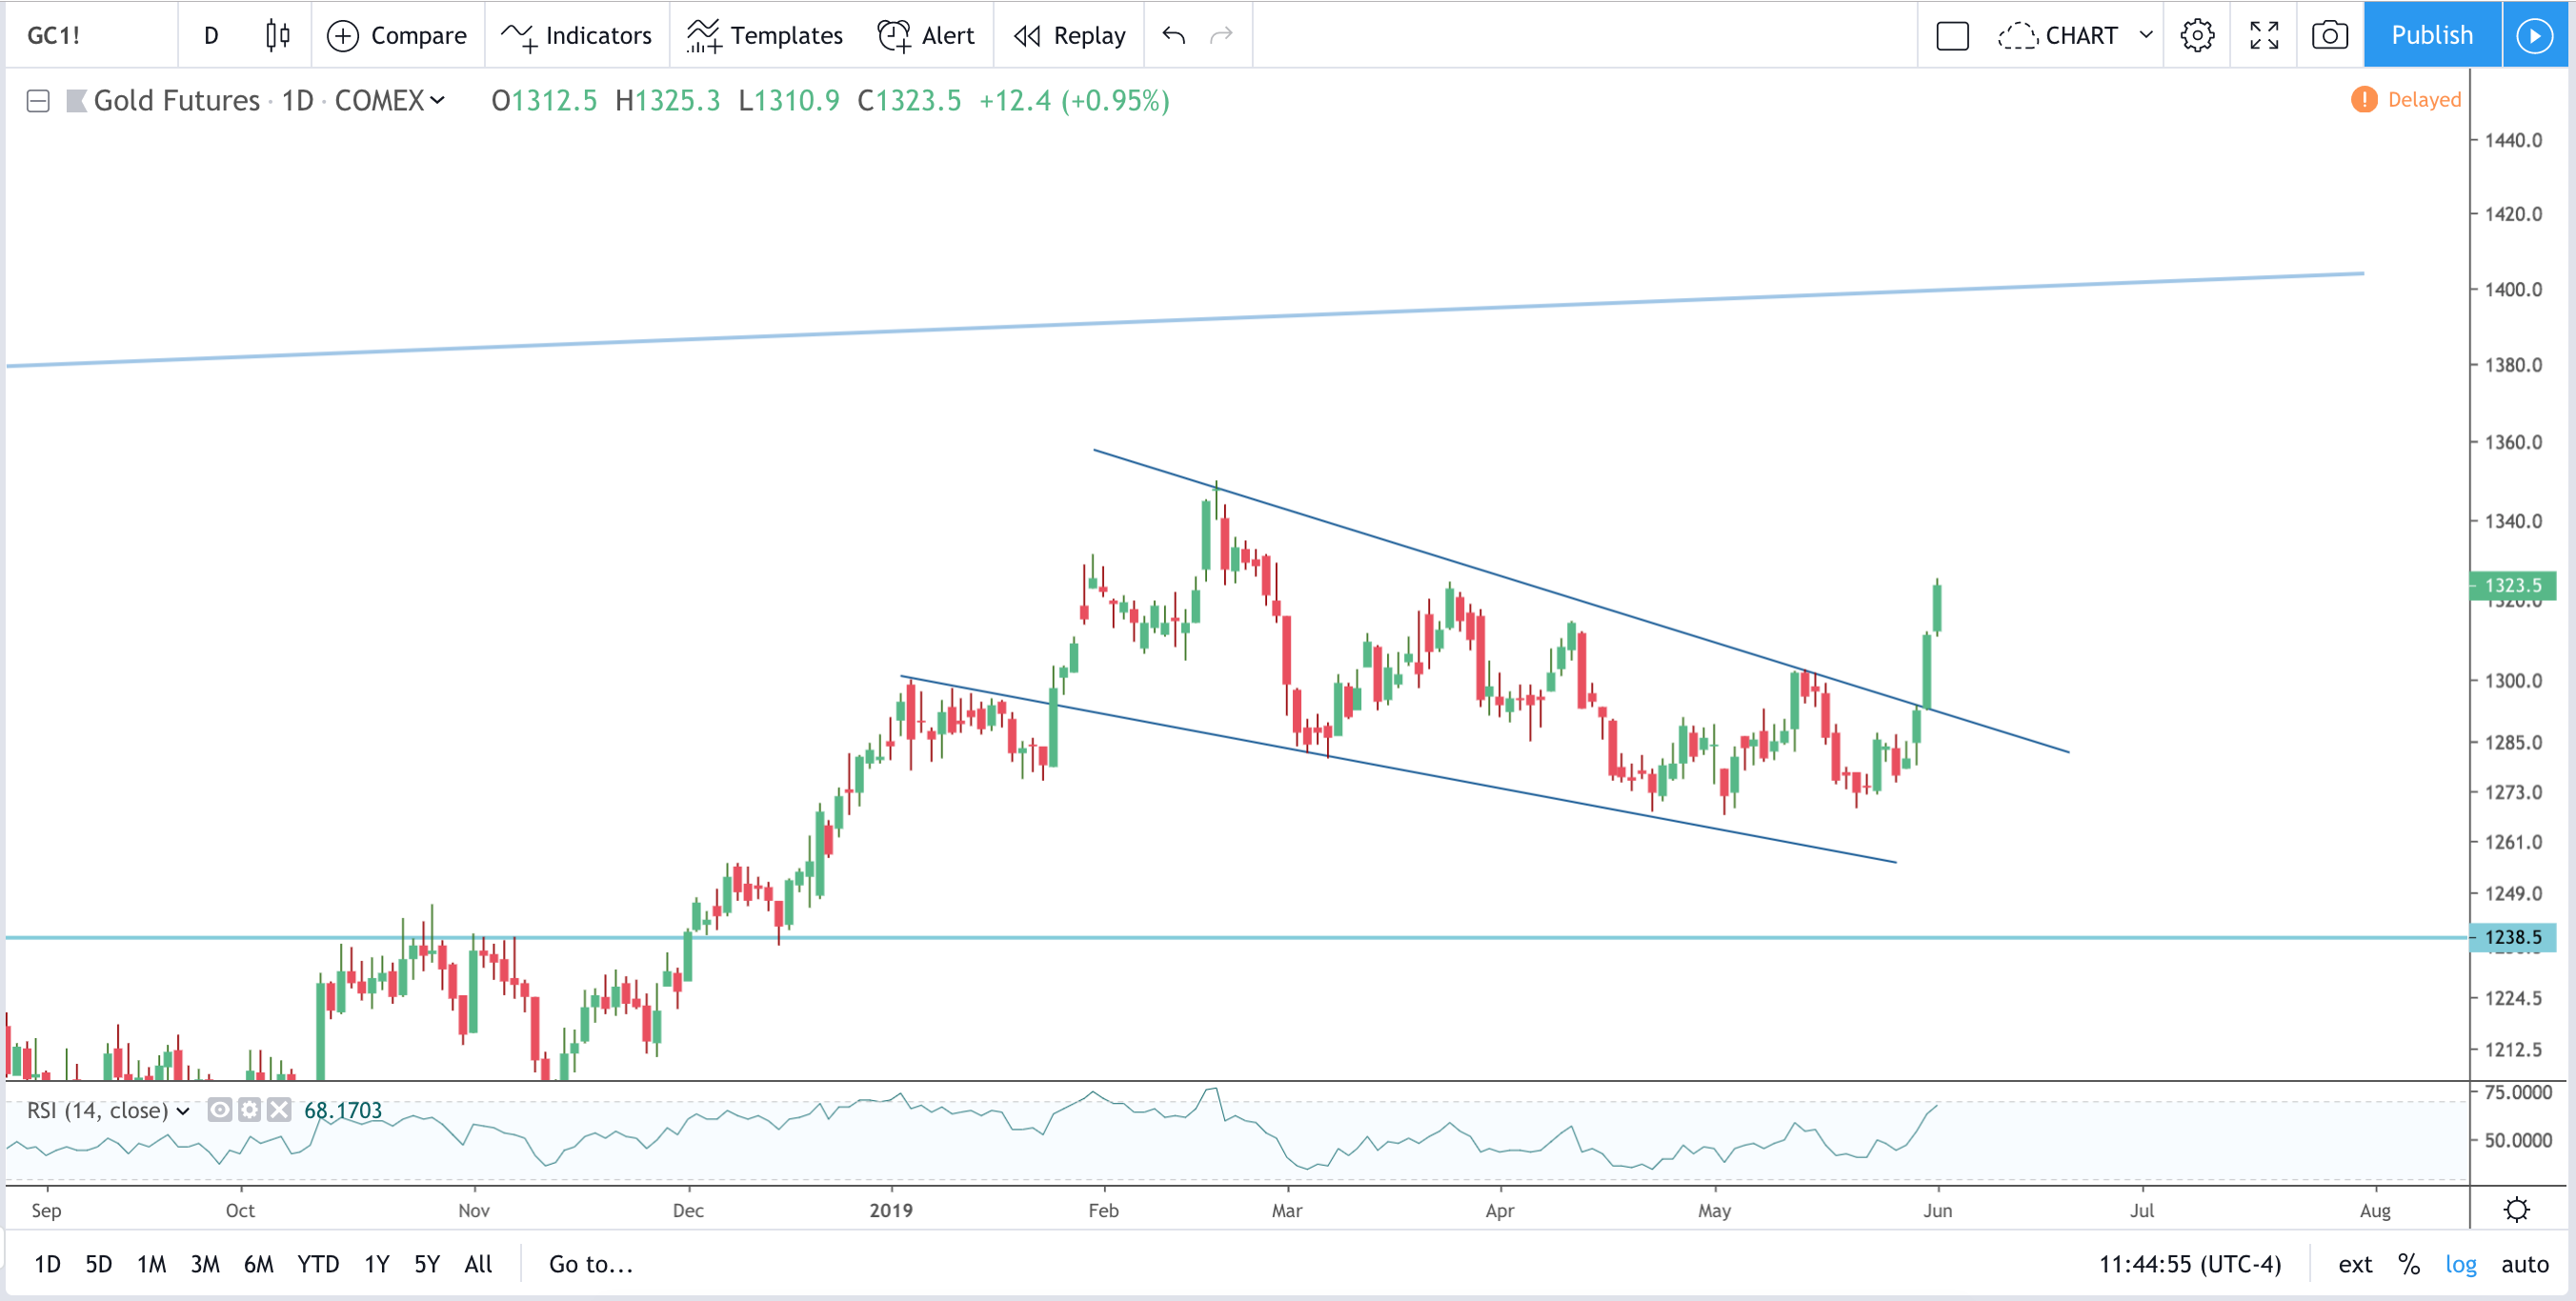
Gold has moved from a bottom at 1167 last July to a peak at 1350 in February. Beginning in February, volatility began narrowing and gold has been mired in a falling wedge pattern. According to Bulkowski (2010), 92% of falling wedge patterns break to the upside, and of those that break, 90% reach the upside target which is measured as the distance from the breakout move to peak, added to the recent breakout. I see the original break as $1238, so in this case, that would set an upside objective at $1400-$1420.
Furthermore, the fact that gold did not retest the support line at ~$1250 speaks to the strength of the bulls here, along with the positive RSI divergence (bottom indicator). Probabilities favor the bulls here.
Silver has been the laggard, as the gold:silver ratio has hit 90 – its highest level since October 2008. I real bull market should see this ratio decline precipitously with silver outperforming gold.
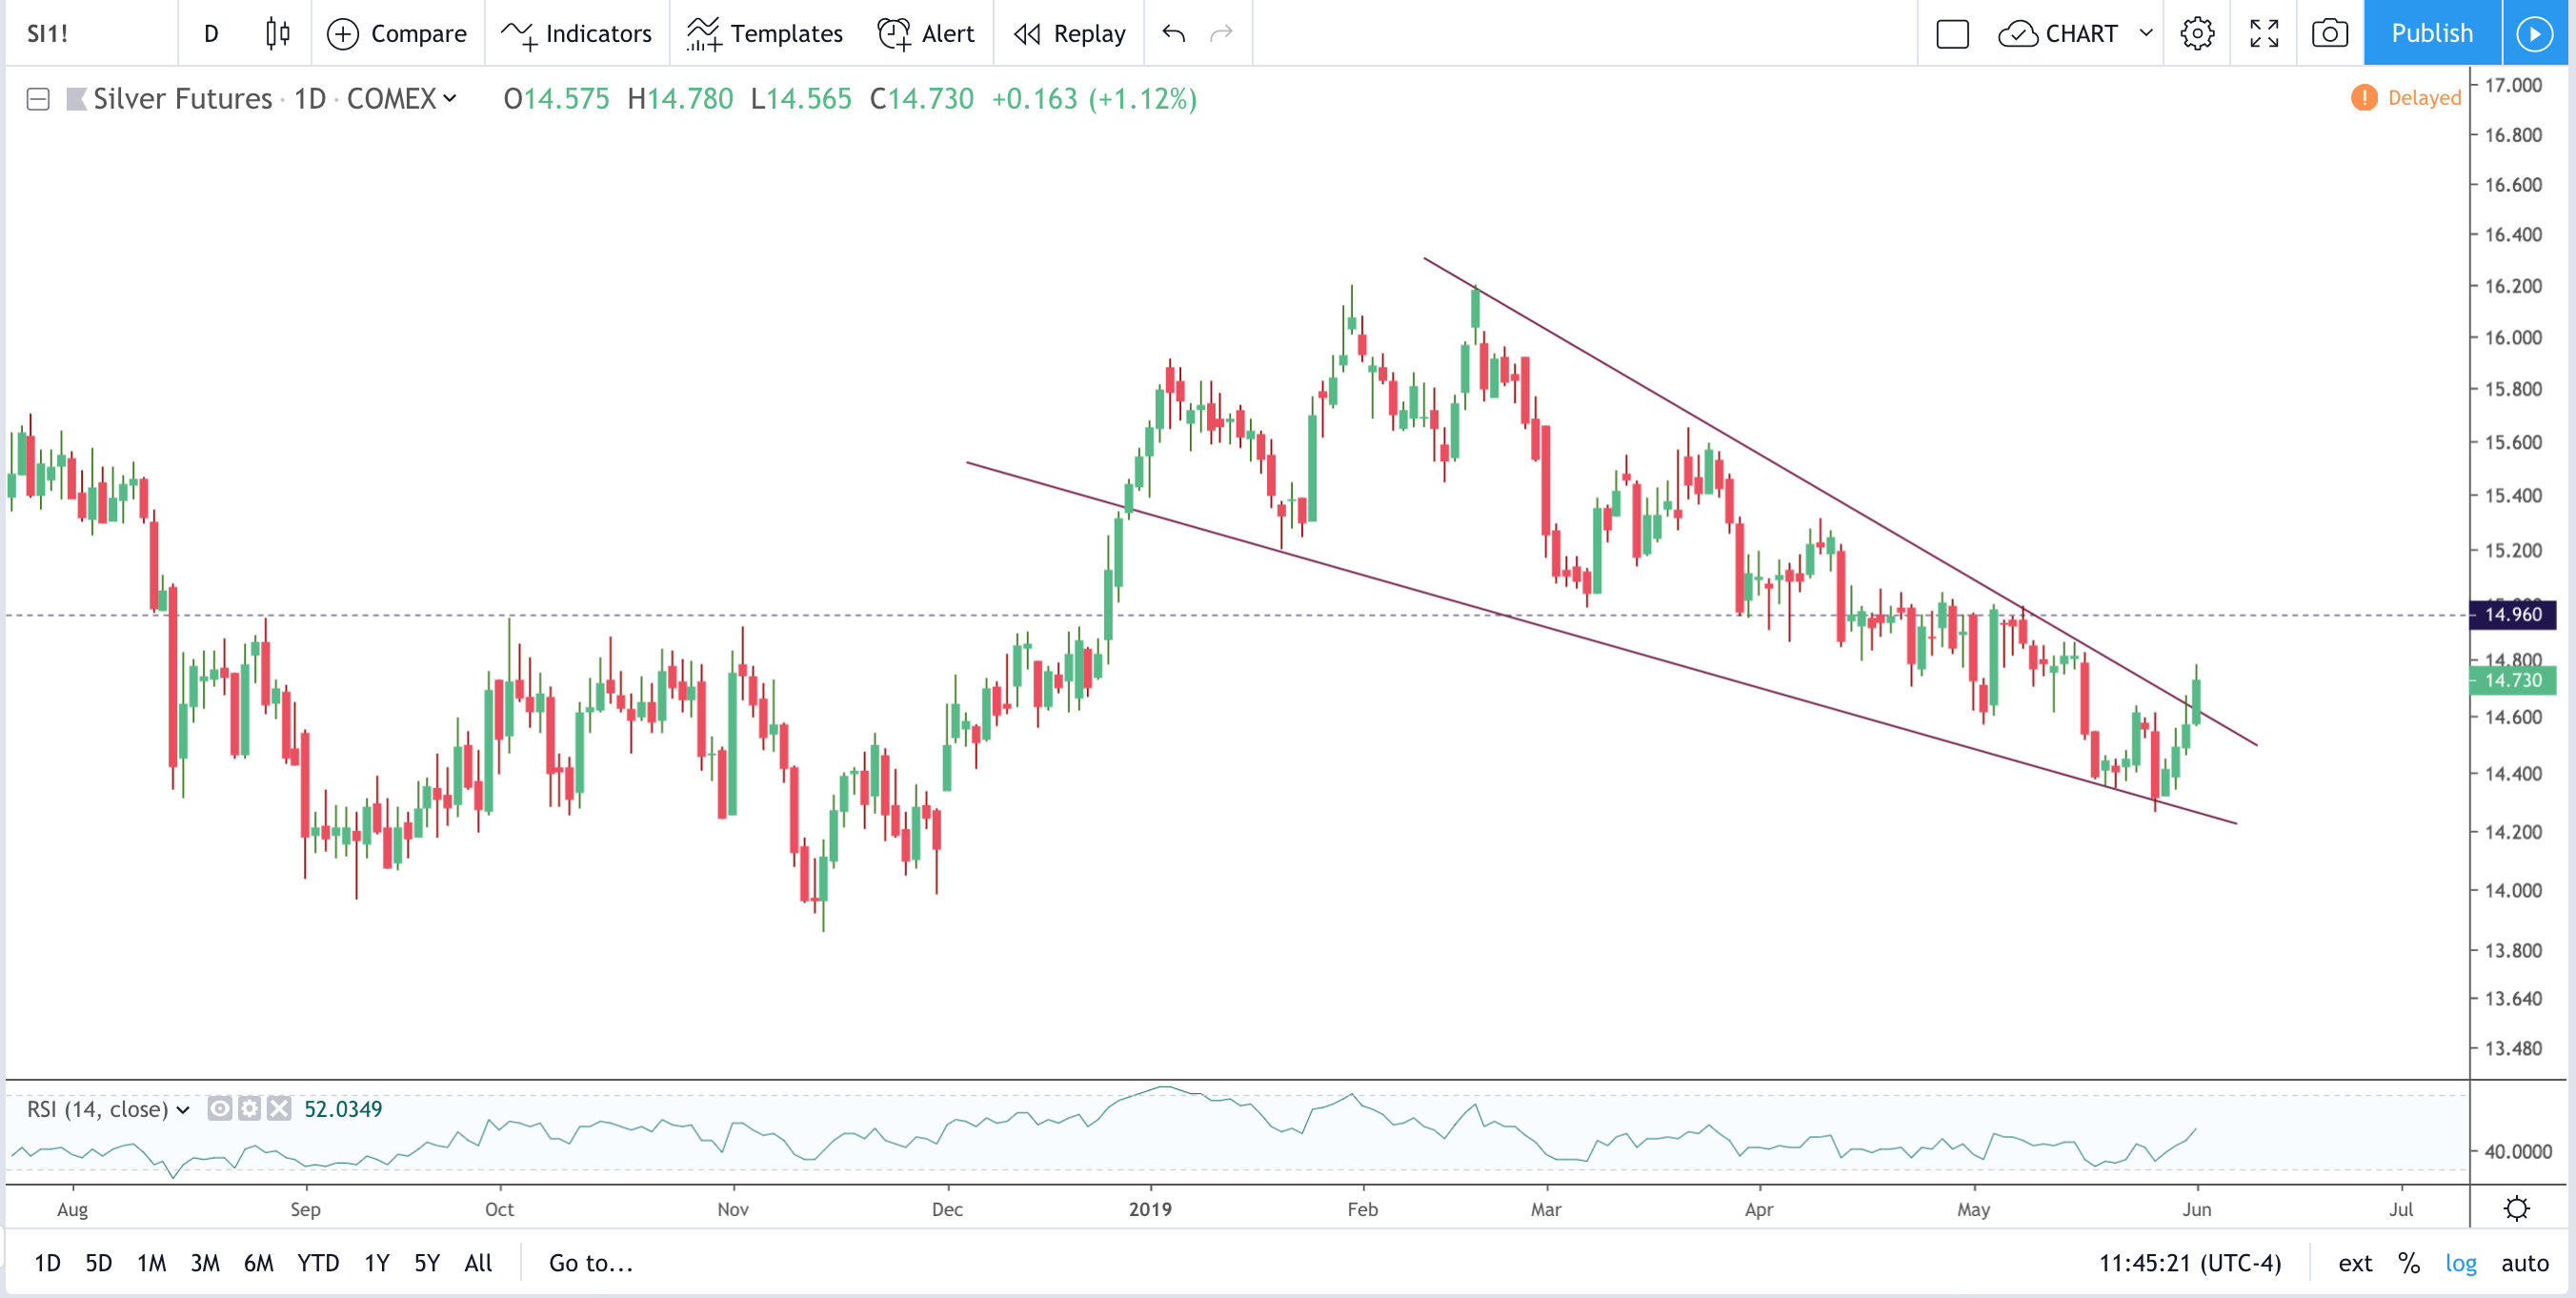
While gold broke its falling wedge pattern on Friday, silver broke this pattern this morning and is now confirming the gold breakout. Technically, this move could push silver to the $16 level.
Related Posts