Testing Resistance
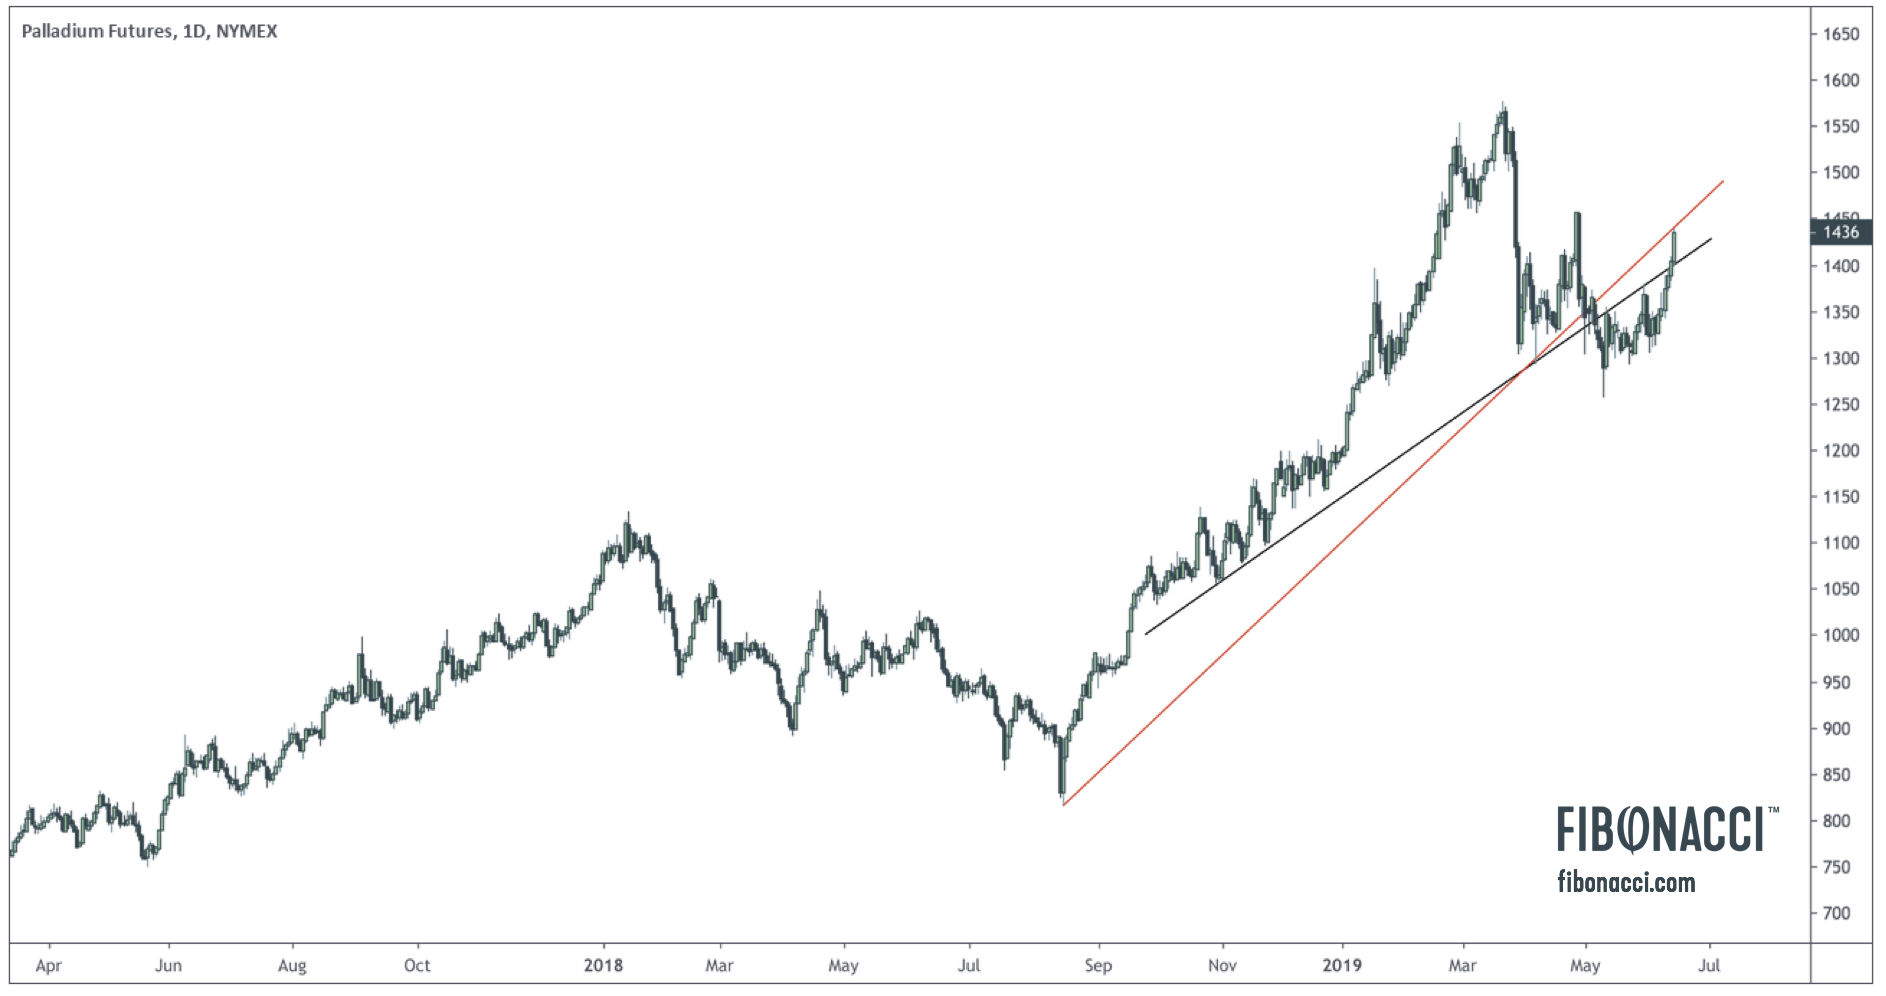
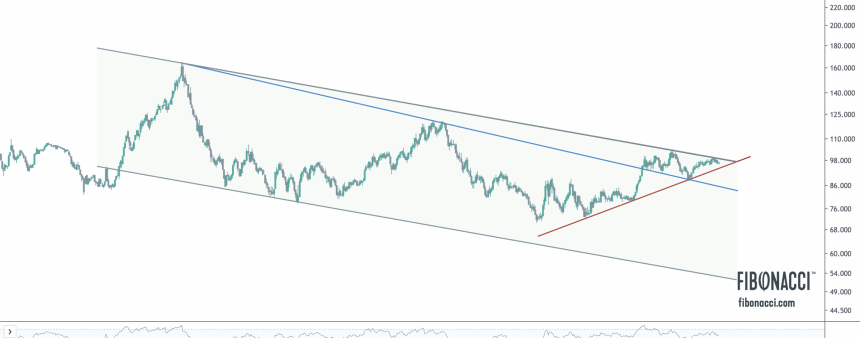
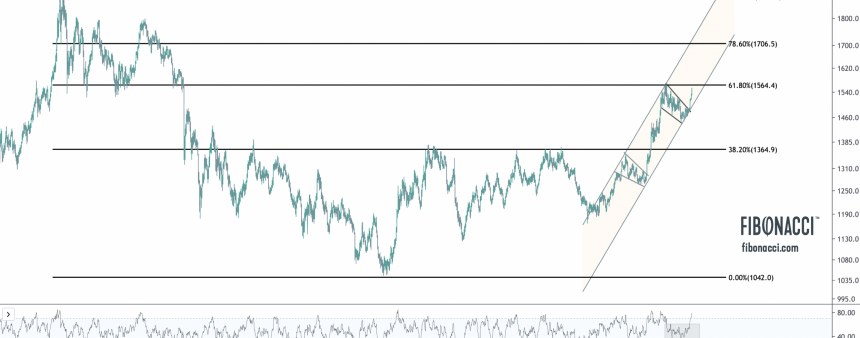
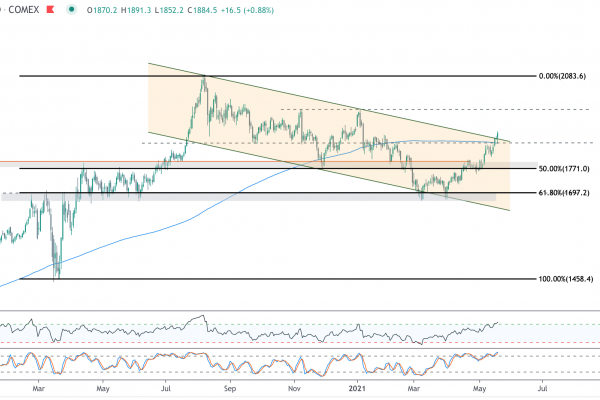
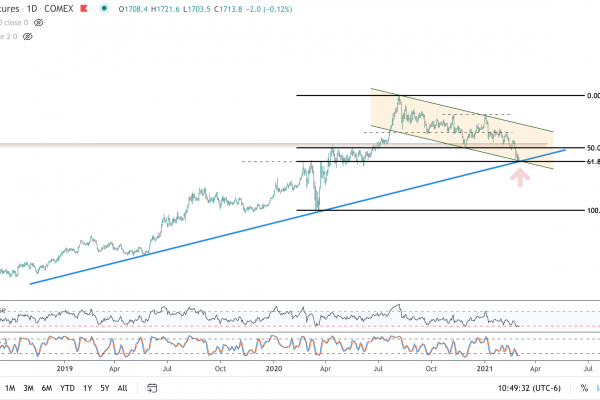
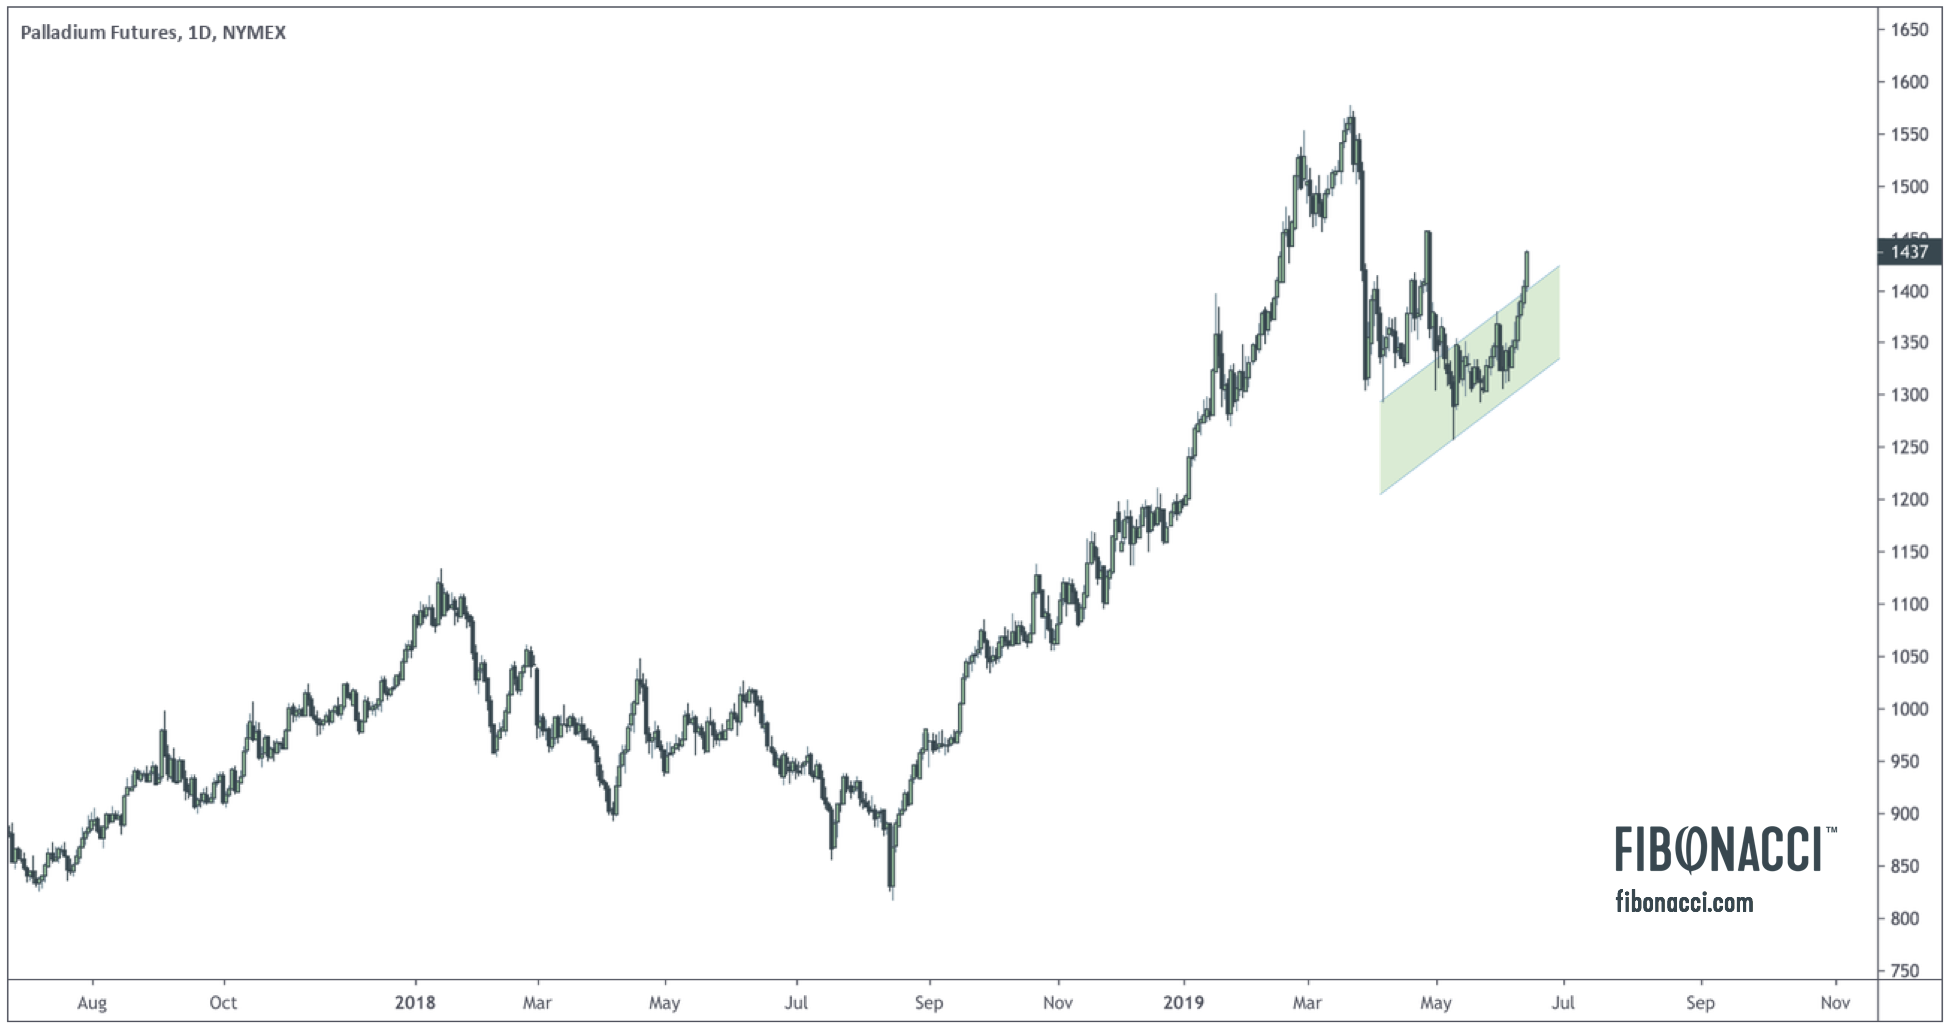
The palladium price broke up from its first test of resistance (blue trend line) and is now in the process of testing its second resistance line (red trend line). This action comes on the heels of a successful test of the 61.8% Fibonacci retracement from the August lows to the March peak, as shown in the chart below.
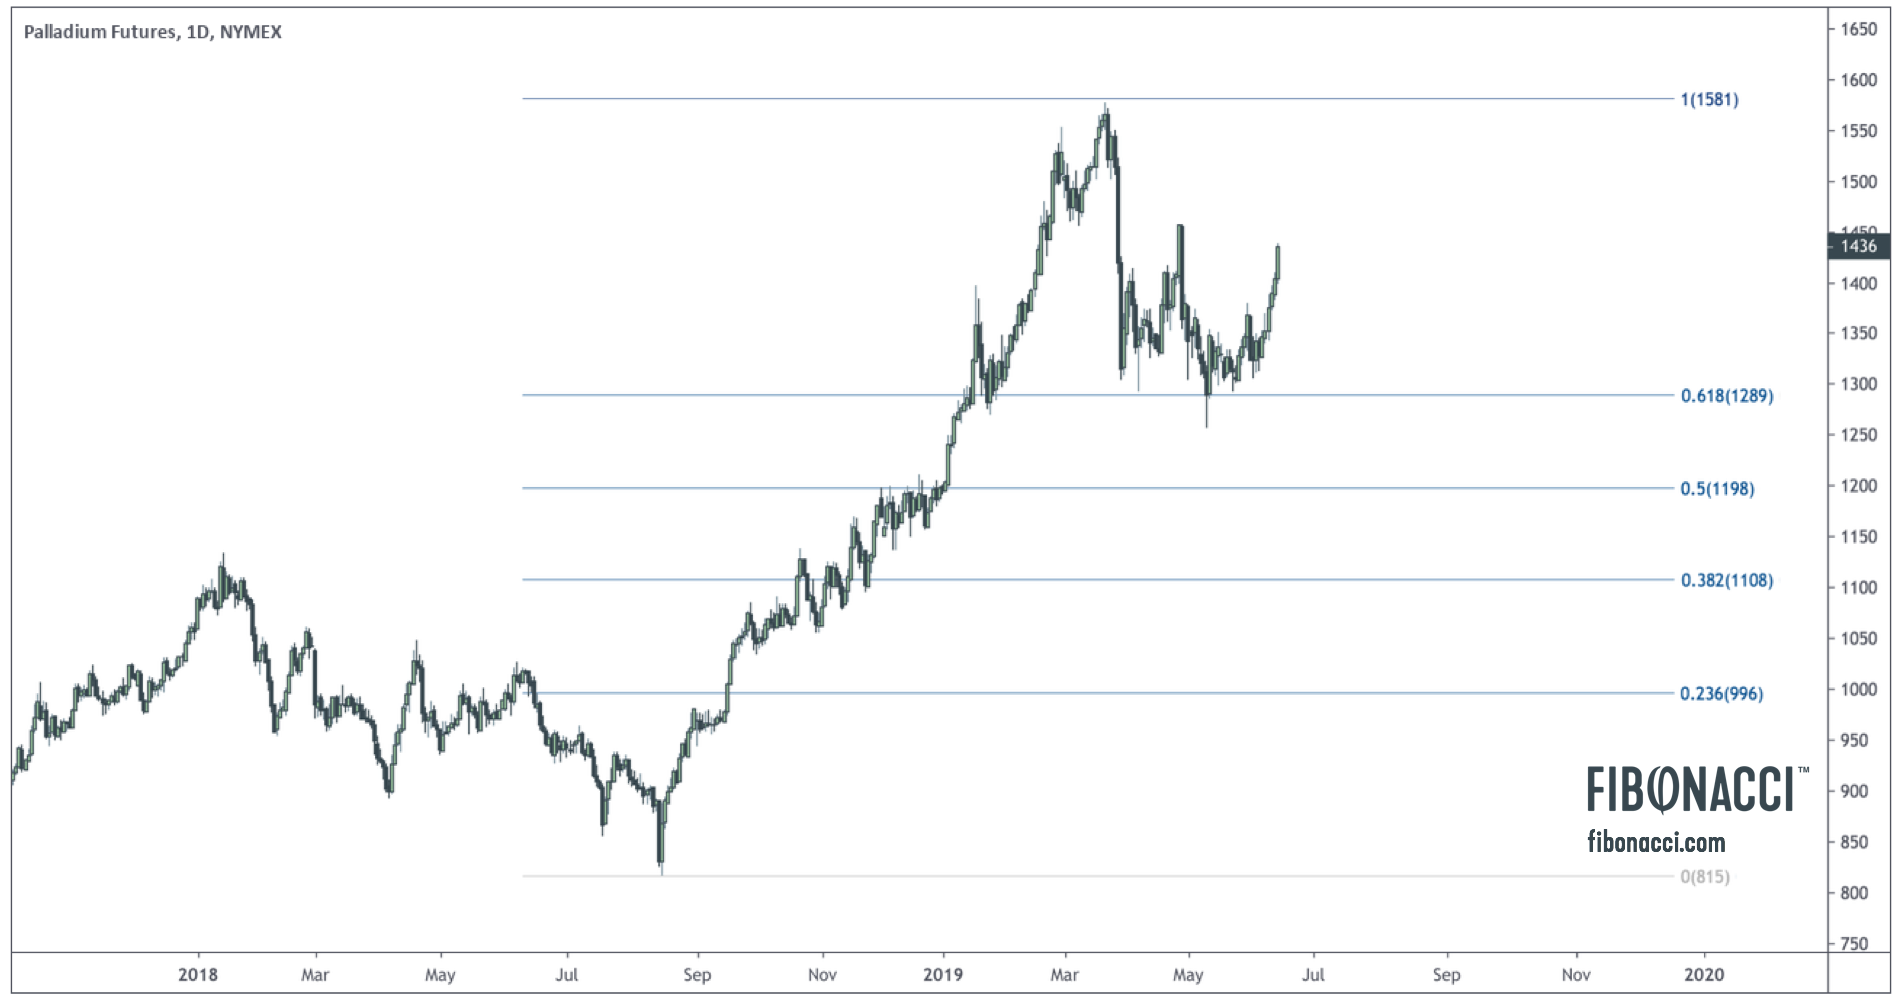
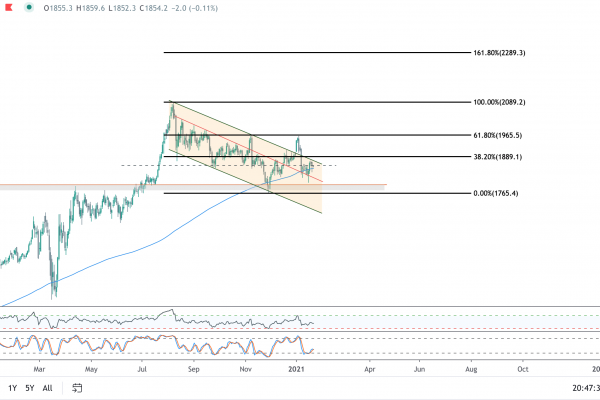
I would also add that the chart appeared to me to be forming a bear flag (a near term pull back) before resuming its downtrend. This flag broke up this morning (very rare), negating the likelihood of that move.
The key price level is $1460. A move above resistance at $1460 should usher in a retest of all-time highs.
Related Posts