Gold
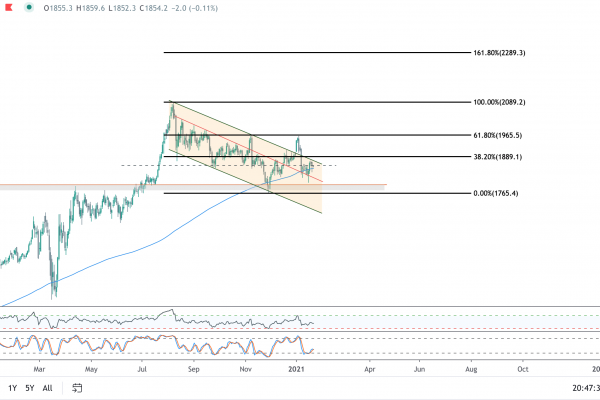
Metals bulls have been frustrated with repeated attempts to break out of a multi-month bull flag/falling channel. At the turn of the new year, with the presidential election all but behind the country, and with calls for more money-printing and ongoing stimulus, it seemed a given that – like the base metals and energy – gold would break out and follow the inflation narrative to higher prices. And, for three days, that is just what happened, as gold pushed from a 2020 close of $1895 to $1960 in the first three days of the new year, only to sell off hard and fall back below falling trend line support. This was gold’s second pass at $1960, which was the 6.18% Fibonacci retracement from the August high to the November low. As the saying goes, from failed moves come fast moves, and the failed move precipitated a $160 sell-off in a week and a half ($140 of which occurred in the 3 days following the peak). It was a major head fake for bulls and stopped out many traders who bought the breakout. Price also lost the 200-day moving average, which was another warning sign for bulls.
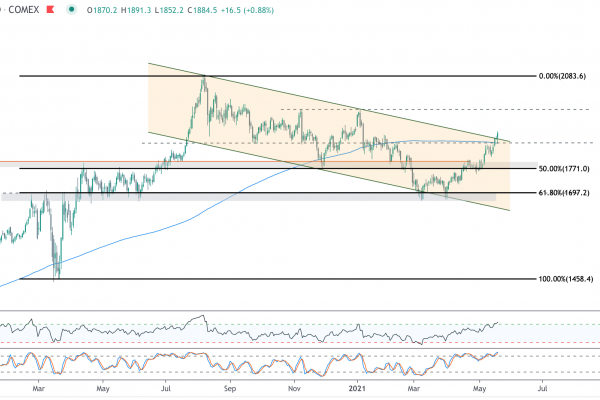
On the positive side, price recently recovered the 200-day moving average, stochastics have turned up, and despite the rapid selloff earlier in the month, the daily RSI never hit oversold conditions. Instead price has been stuck in no man’s land between 1800-1900 per ounce. The next real move can’t begin until gold recovers $1890 to break falling resistance and hurdle the 38.2% Fib retracement.
Silver & Platinum
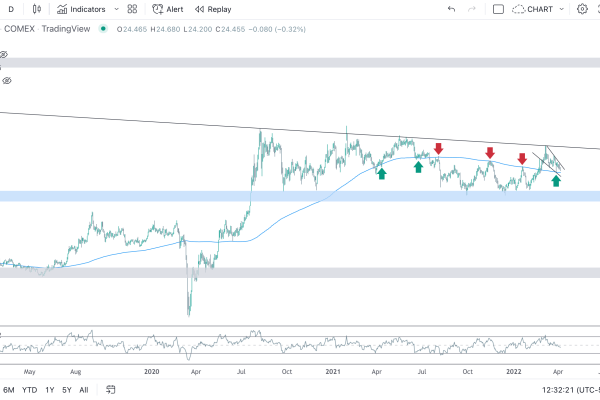
While gold has struggled, silver and platinum have remained surprisingly resilient. The higher beta cousins of the yellow metal tend to trend with gold, but more dramatically in percentage terms. It would seems both are being supported by the run-up in base metals, as each have industrial properties that are far broader than gold. In fact, on several occasions this month silver and platinum have traded up on days when gold has traded down. Silver remains stuck at long term support between $25-$26, nearly broke rising trend support with intraday dips into the $24 range, only to close above support. It’s now decision time as price is pinching between horizontal resistance and rising support. A key pivot point is $26.07, and a secular breakout occurs above $28.11.

For platinum, $1200 is the key level to watch. As platinum approaches $1200, I would expect to see some consolidation or a pullback as it builds the necessary power to break through long term resistance. This has been the key level since 2014. A break above $1200 opens up a move to $1300, above which would be extremely bullish.

Dollar
The recent dollar rebound has been the major headwind for the metals. As I stated in a previous post, the trend remains down and all signs point to further weakness. One final thrust towards 91 seems plausible, but ultimately price seems destined for 88.

S&P 500
The inflation narrative and weakness in bonds have supported higher equity prices. The Nasdaq in particular is an unstoppable train. Equity markets across the globe have been breaking out, and risk appetite is growing. Whatever you may think about valuations and the weakness of underlying economic conditions, all signs point toward higher equity prices ahead. For the S&P 500, 4000 is an important psychological level, with my near term target pushing to 4150.

As always, we appreciate your feedback!
The month of November was a bit of a roller coaster for metals bulls, as price appeared to breakout, only to reverse on vaccine news and become extremely oversold by mid-December. All the more frustrating was the continued sell-off in the US dollar, which many expected to spark the next leg higher in metals prices, but new lows in the dollar coincided with multi-month bottoms in metals. Meanwhile, all attention has since returned to bitcoin, which broke out to all-time highs while metals remained in consolidation mode. So, where are we now?
The thesis that I outlined in my post on October 14th remains the same: Metals up, Equities Up, Dollar down. The expectation then, as now, is for the 2021 reflation/inflation trade. To be clear, this expectation is not based on any personal macro-opinion; it is based on how I see price reacting to this general market consensus. The market can be wrong, and if it is, and inflation expectations are overblown, the price will warn us.
Let’s start with the hot topic du jour: Bitcoin.
Bitcoin
Bitcoin finally eclipsed its 2017 euphoric high last week and screamed to just north of $24,000/coin, which represents the 127.2 Fib Extension measured from the 2017 high to the March 2020 low. Fundamentals aside (are there any?) price looks poised to test $30,000 (the 161.8 Fib extension) on the next thrust. By any technical measure, bitcoin is in a major secular bull market, and the heights it may reach will likely shock many.

Silver
Silver broke out in a big way in overnight trading with a massive $1.40 move late Sunday, December 20th. After finally breaking through falling resistance of its bull wedge in early December, silver eclipsed the all-important $26 level, which has served as either support or resistance no less than 11 times since 2011, and most recently following the September blow off high. This breakthrough now sets up an initial retest of $30/ounce, with $37 beyond there.

Long term:

Gold
Gold has quietly rallied $140 since the big sell-off in late November, and it is now knocking on falling resistance of its multi-month bull flag. As of this writing, price is on the cusp of a breakout at $1910, which sets up a quick retest of $1940 and $1960, above which should push price back north of $2100.

GSR
The Gold:Silver Ratio also continues to trend lower, which is an encouraging sign for bulls, as it implies stronger risk appetite in the space.

US Dollar
For the US Dollar, there is not much to add here. The trend is down, and 88 is a very key level, where we should expect to see some near term support. If price doesn’t hold there, the US dollar will likely fall into the 70s on the index.

As always, we appreciate your feedback. Have a Merry Christmas!
In my last post, I commented on the strong breakouts in metals out of bull wedge consolidations. These breakouts were ultimately short-lived and quickly reversed on vaccine news, washing out swing longs and once again pushing price lower to another test of falling resistance. The thesis from that post remains intact – metals continue to remain in strong uptrends with price likely to push to higher highs – but in the near term price continues to digest supply and needs more time.
GOLD
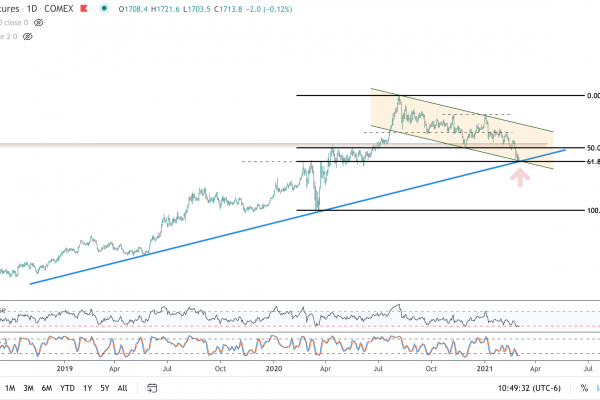
Gold has a confluence of support coming in at 1832, 1828, and 1822. Below there, 1790 lingers as the key breakout level from the 7-year base. With stochastics oversold, the downside on this selloff looks limited. For those with a longer time horizon, the area between 1790-1830 is a strong area of support.

SILVER
In Silver, I am watching 23.08 (retest of 161.8 Fibonacci extension) and 22.57 (the anchored VWAP from March low) as important levels. Like gold, silver is getting a little oversold on stochastics and I think the 22.57-23.08 is very likely to hold.

10-Yr NOTES
Gold has been highly correlated to 10-year notes, which have also been consolidating and are now coming into rising support from the October 2018 low. Long consolidations like this within strong uptrends are much more likely to resolve in the direction of the underlying trend, and if 10-year notes rally off support, we can expect gold to be not far behind.

As always, I would love to hear your feedback. And Happy Fibonacci Day: 11-23!
Today is November 6th, we still do not have a President-elect, and the legal fight over ballots and vote-counting seems destined to drag on for weeks, if not months. For those investors determined to allocate capital based upon the election outcome, the uncertainty can be paralyzing. We can expect a likelihood of a split government, but there is no certainty beyond that. My solution is to follow price.
In my last piece, I noted that precious metals were trending up, and the US Dollar was trending down. Yesterday’s price action confirmed that, following a multi-week consolidation period, these trends have resumed.
Big Gold Breakout
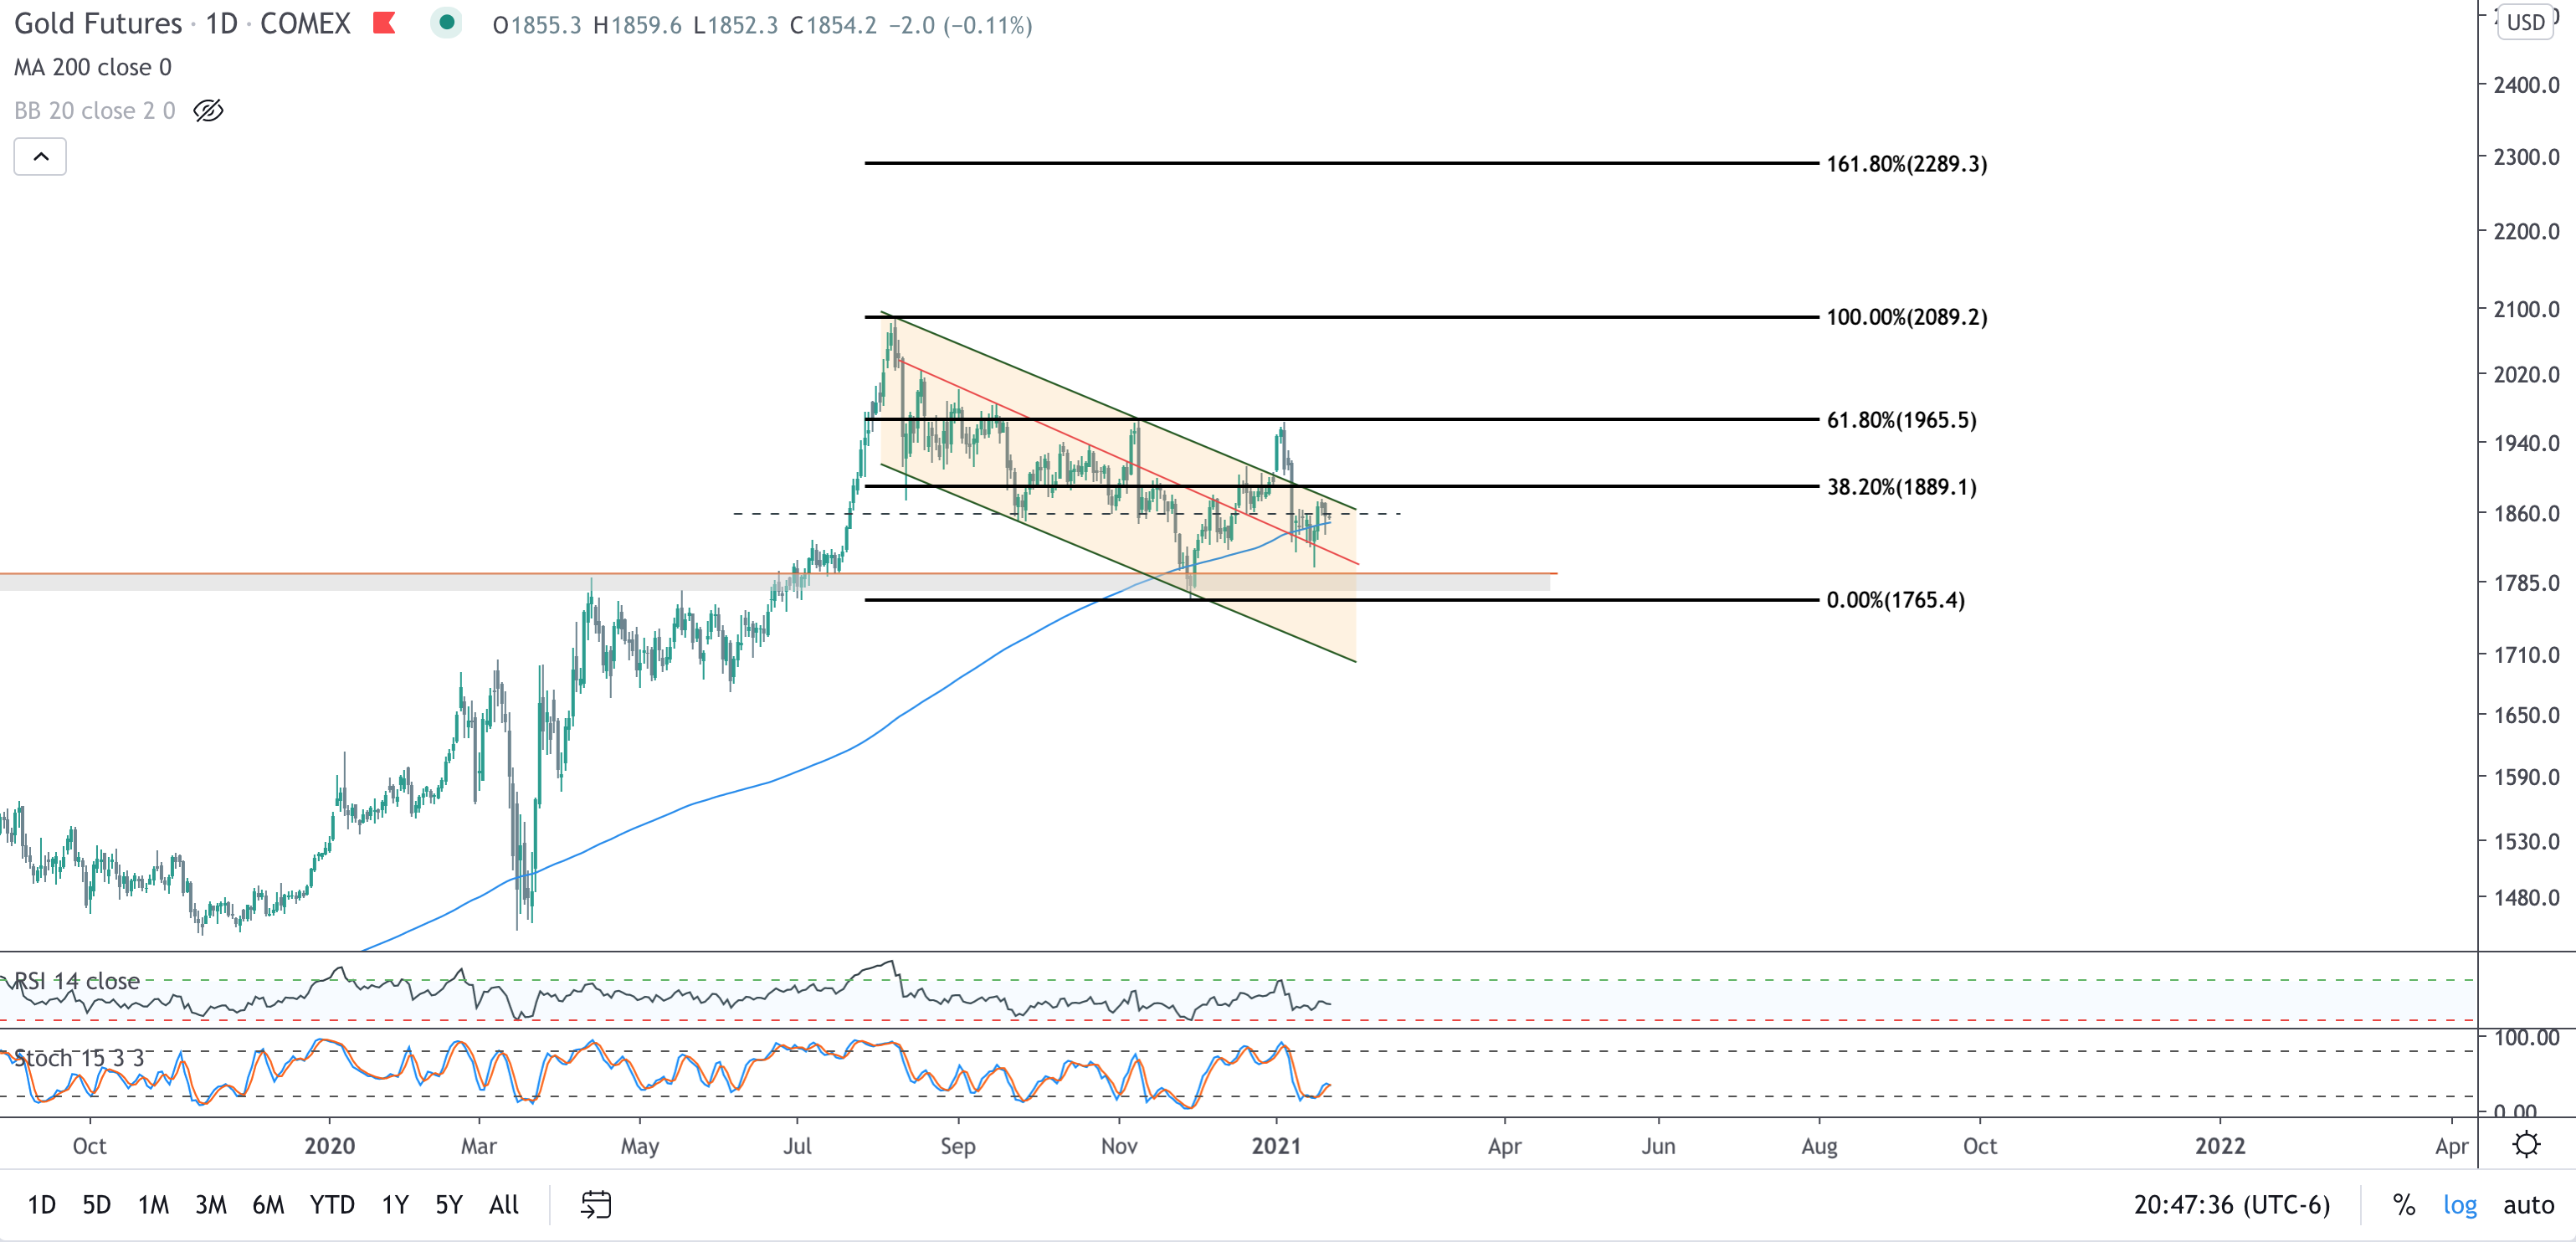
Using the March peak/trough in gold has been a reliable Fibonacci measure for extension levels. The pullback from the August high was nothing more than a rejection at the 261.8 Fibonacci extension and a retest of the breakout at the 161.8 extension. Yesterday’s bull wedge breakout on a monster $50 candle, while breaking out above the 50 day moving average, suggests that gold is setting up for another run to 261.8 extension. Note also that after getting extremely overbought at the August peak, gold never hit oversold conditions throughout the entire consolidation period, suggesting that bulls are still in control.

Silver Also Confirming
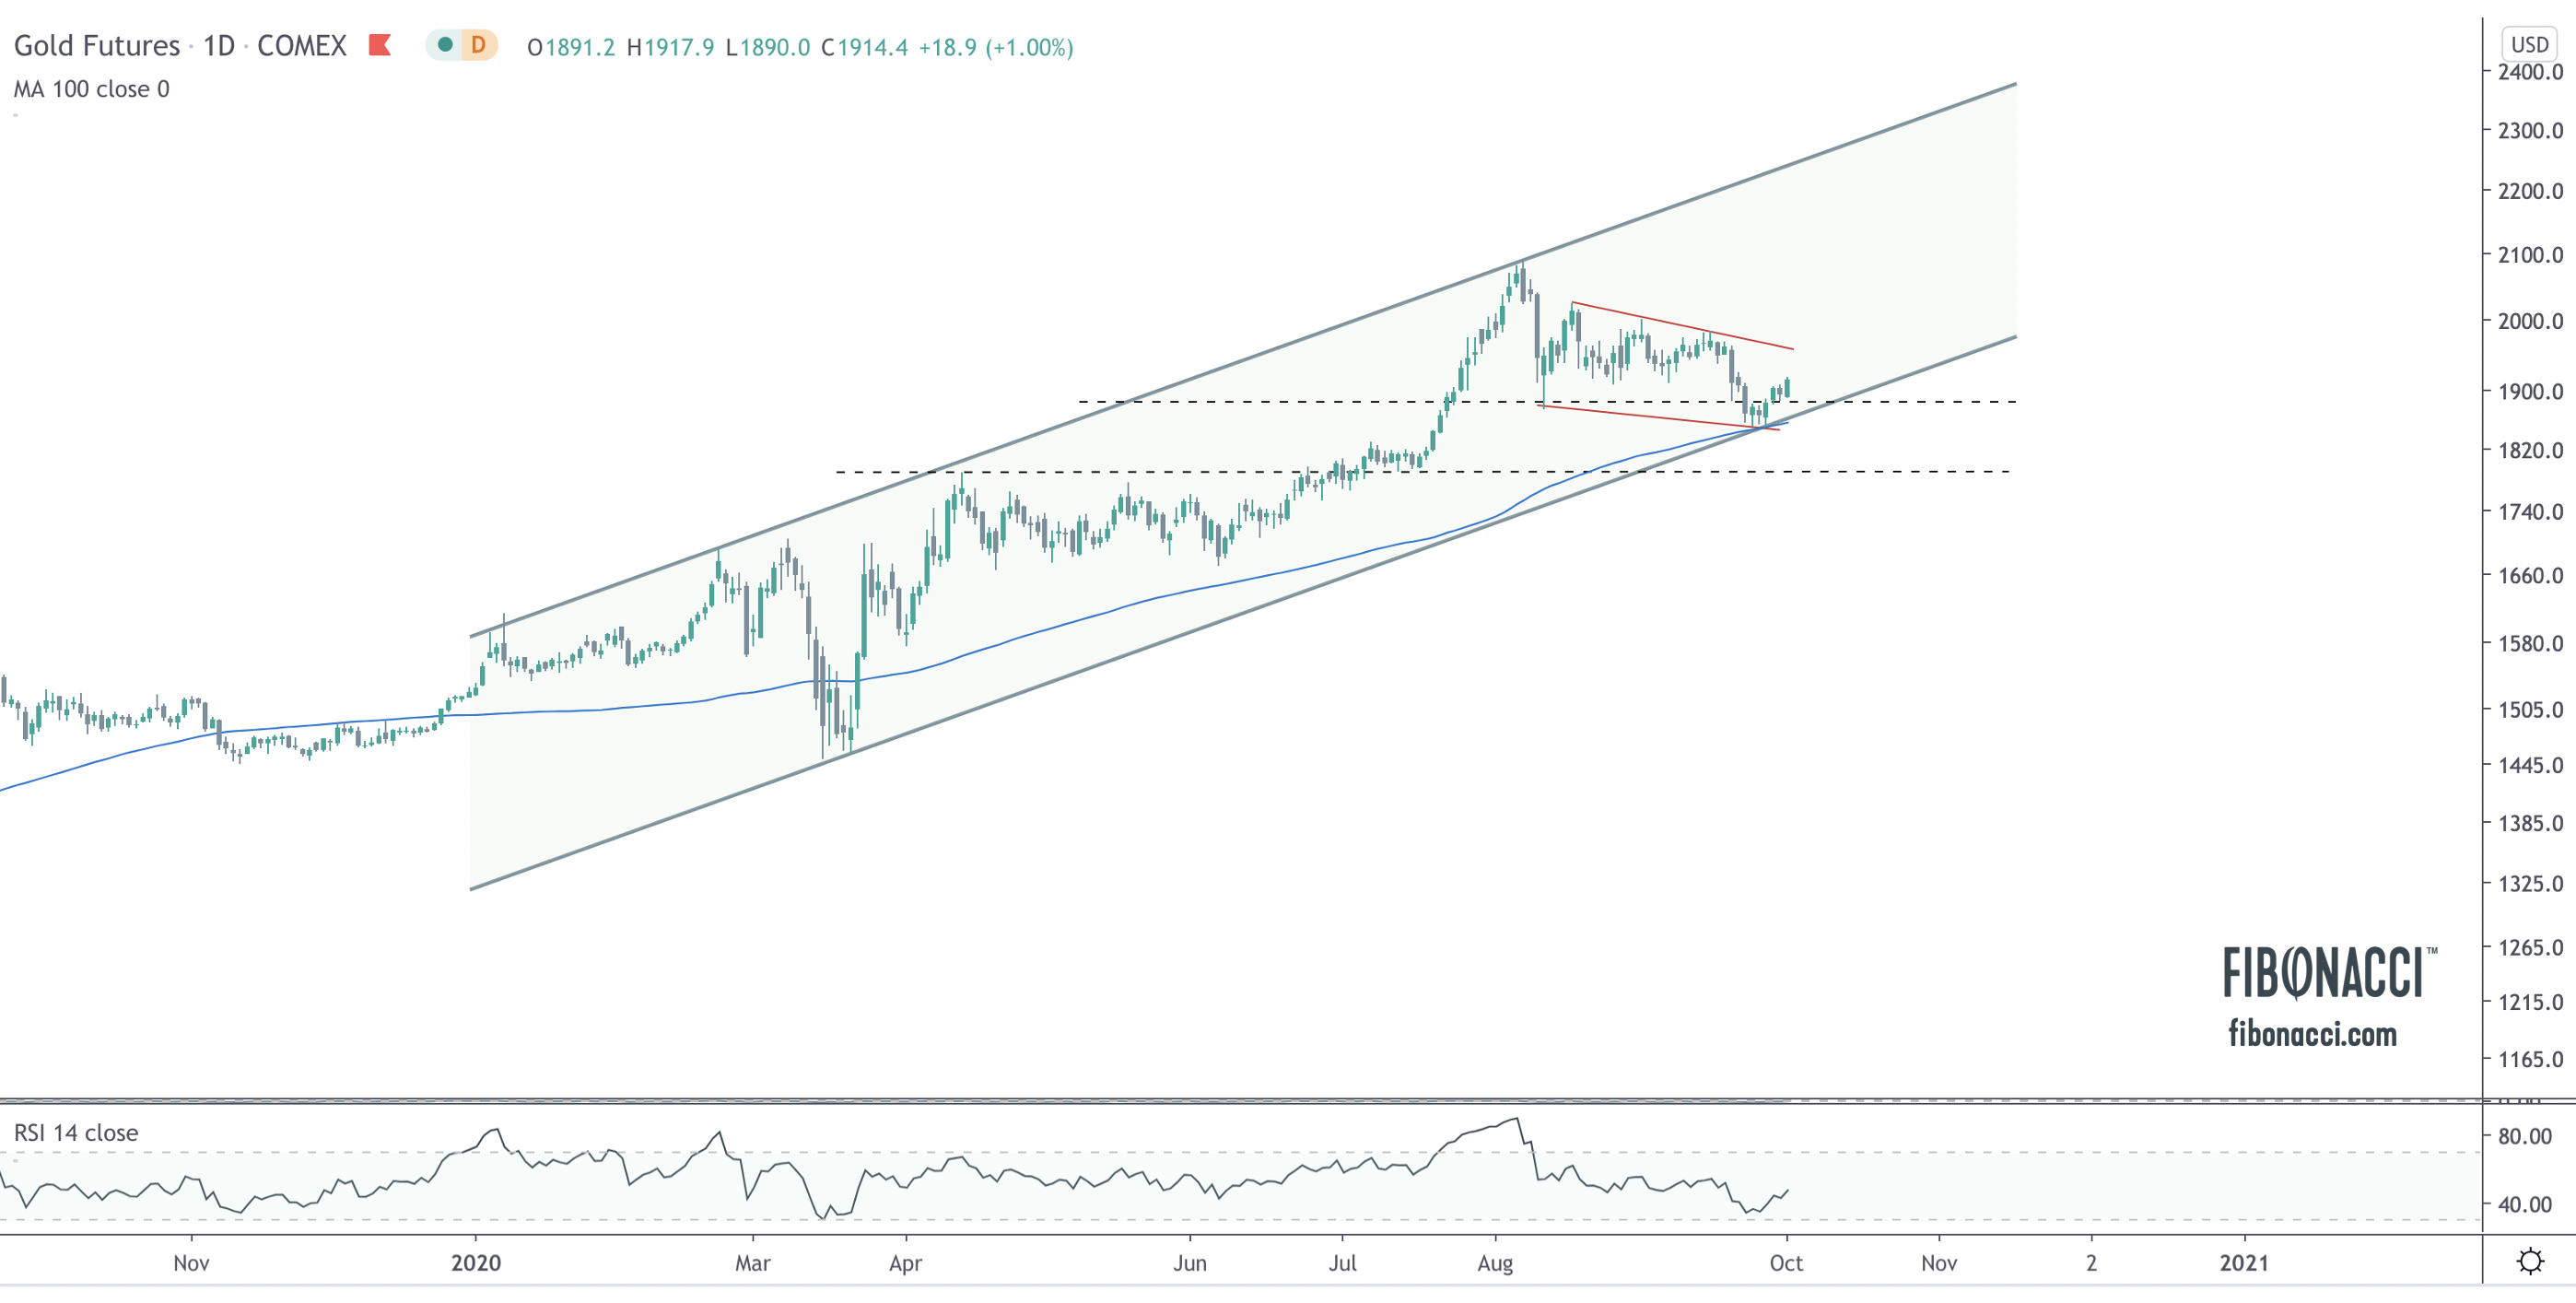
Silver made a statement with yesterday’s bullish move. I noted on election night that silver looked vulnerable and needed to breakout in order to avoid future trouble. Within 48 hours price exploded out of its bull wedge on a $1.60 single day move. The chart looks extremely constructive now. The anchored volume-weighted average price from the March low held throughout the consolidation period, and similar to gold, 161.8 Fibonacci extension from the March low held, the bull wedge broke to the upside, the 50 DMA was eclipsed, and price is now retesting prior support at $26. A move above $26 should push a retest of the 261.8 Fibonacci extension.

Gold/Silver Ratio – false breakout
Earlier this week, the Gold/Silver ratio appeared to be breaking out, which was concerning for bulls. Generally, a rising GSR is a risk-off signal for metals (gold outperforming silver). The big turnaround in yesterday’s price brought the ratio back below falling resistance. As the saying goes – “from failed moves come fast moves.” A weekly close below falling resistance increases the likelihood that the ratio will continue to fall.

GDX and GDXJ Breaking Out Also
The charts of GDX (Gold Miners ETF) and GDXJ (Gold Junior Miners ETF) look very similar. The chart below is that of GDXJ. After breaking out above long term resistance at $52, price has neatly consolidated for three months forming a multi-month bull flag which perfectly retested prior resistance (now support). Yesterday, price finally broke falling resistance of the bull flag. Like gold and silver, these junior miners never hit oversold conditions through the consolidation and appear poised for the next leg higher.

Equities also look constructive
The S&P 500 is up also 300 points from the election night low. The key 3230 level – which has acted as both resistance and support and has been tested four times since May – held. Price is now coming into falling resistance from the August high. 3530 is resistance to the upside. Bulls would like to see a big push through that level to confirm the next leg higher is underway, a run that should take price to ~4,000, which is the measured move from the June breakout and the upper bound of the 12-year rising channel. Like the metals, price never hit oversold conditions on the retest of support and bulls remain in control. On the downside, 3230 remains key support, with the 200 DMA and anchored VWAP from the March low sitting just below ~3115.

The Dollar shows little sign of strength
From a technical perspective, the trend in the dollar is down. This is a fact, not opinion. The dollar has a downward sloping 200 DMA, hit oversold conditions twice during the summer, never was overbought on the short term rally, and remains on the precipice of breaking support again at 92. This is not a chart anyone should be looking to buy. A break above 95 would change the technical outlook.

As always, I would love to hear your feedback!
GOLD
The price coiling I highlighted in gold in my last post failed to the downside, which I mentioned was a possibility. There were two key levels, the 1865-1880 band, and then 1800, which would have retested the entire move. Buyers came in strong at 1865 and price held, right at the 100 day moving average. The breakdown from the pennant has created a bull wedge, and the RSI (relative strength index) never hit oversold levels, which implies to me that bulls remain in control. Gold is not completely out of the woods – a breakout of that bull wedge would confirm that 1865 was the interim low. I am looking for confirmation above 1935 and then 1950 for next sizable move. The price action in silver and the miners confirm this thesis.
SILVER
Like gold, silver never got oversold on the 14-day RSI during the recent selloff, and price similarly bottom-ticked the 100 DMA. A break above the recent high of 24.57 should set up a retest of 26.
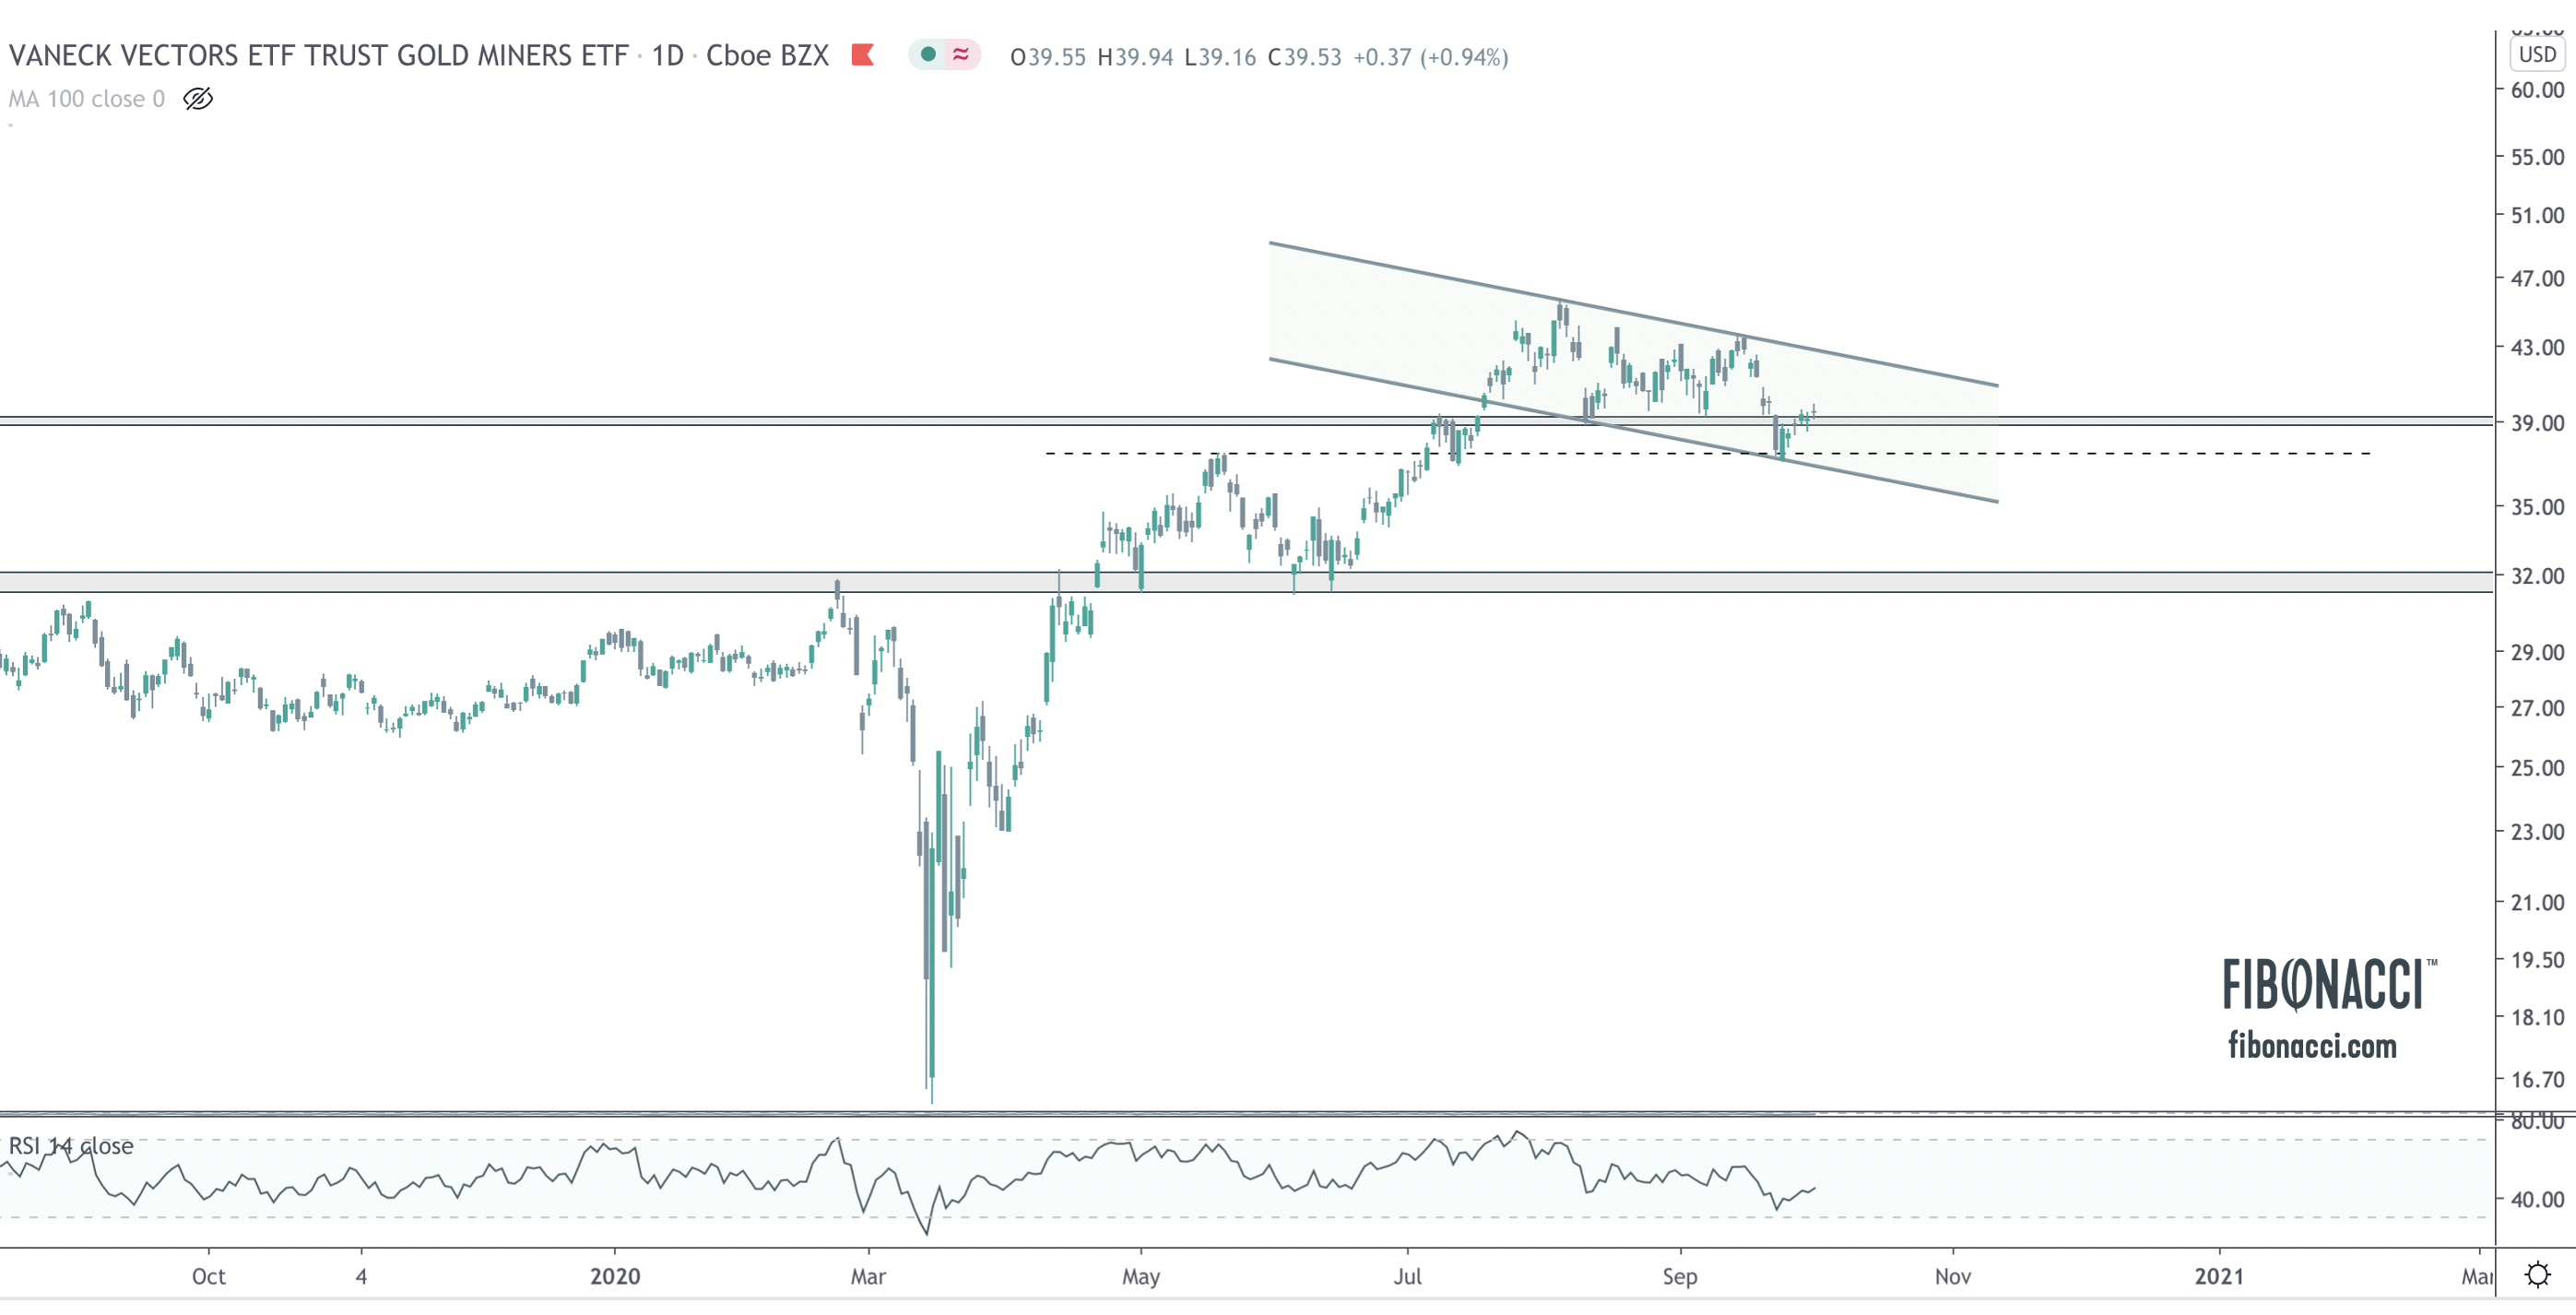
GDX – Gold Miners ETF
GDX appears to have successfully recovered support at 39. At the moment, the recent sell off looks like a false breakdown from horizontal support, and price has formed a bull flag during this recent consolidation. Like the metals, RSI never got oversold during the sell off. This looks to me like a 2-3 month healthy consolidation in order to digest the explosive gains from the March low. Bulls just need price to stay above 37.
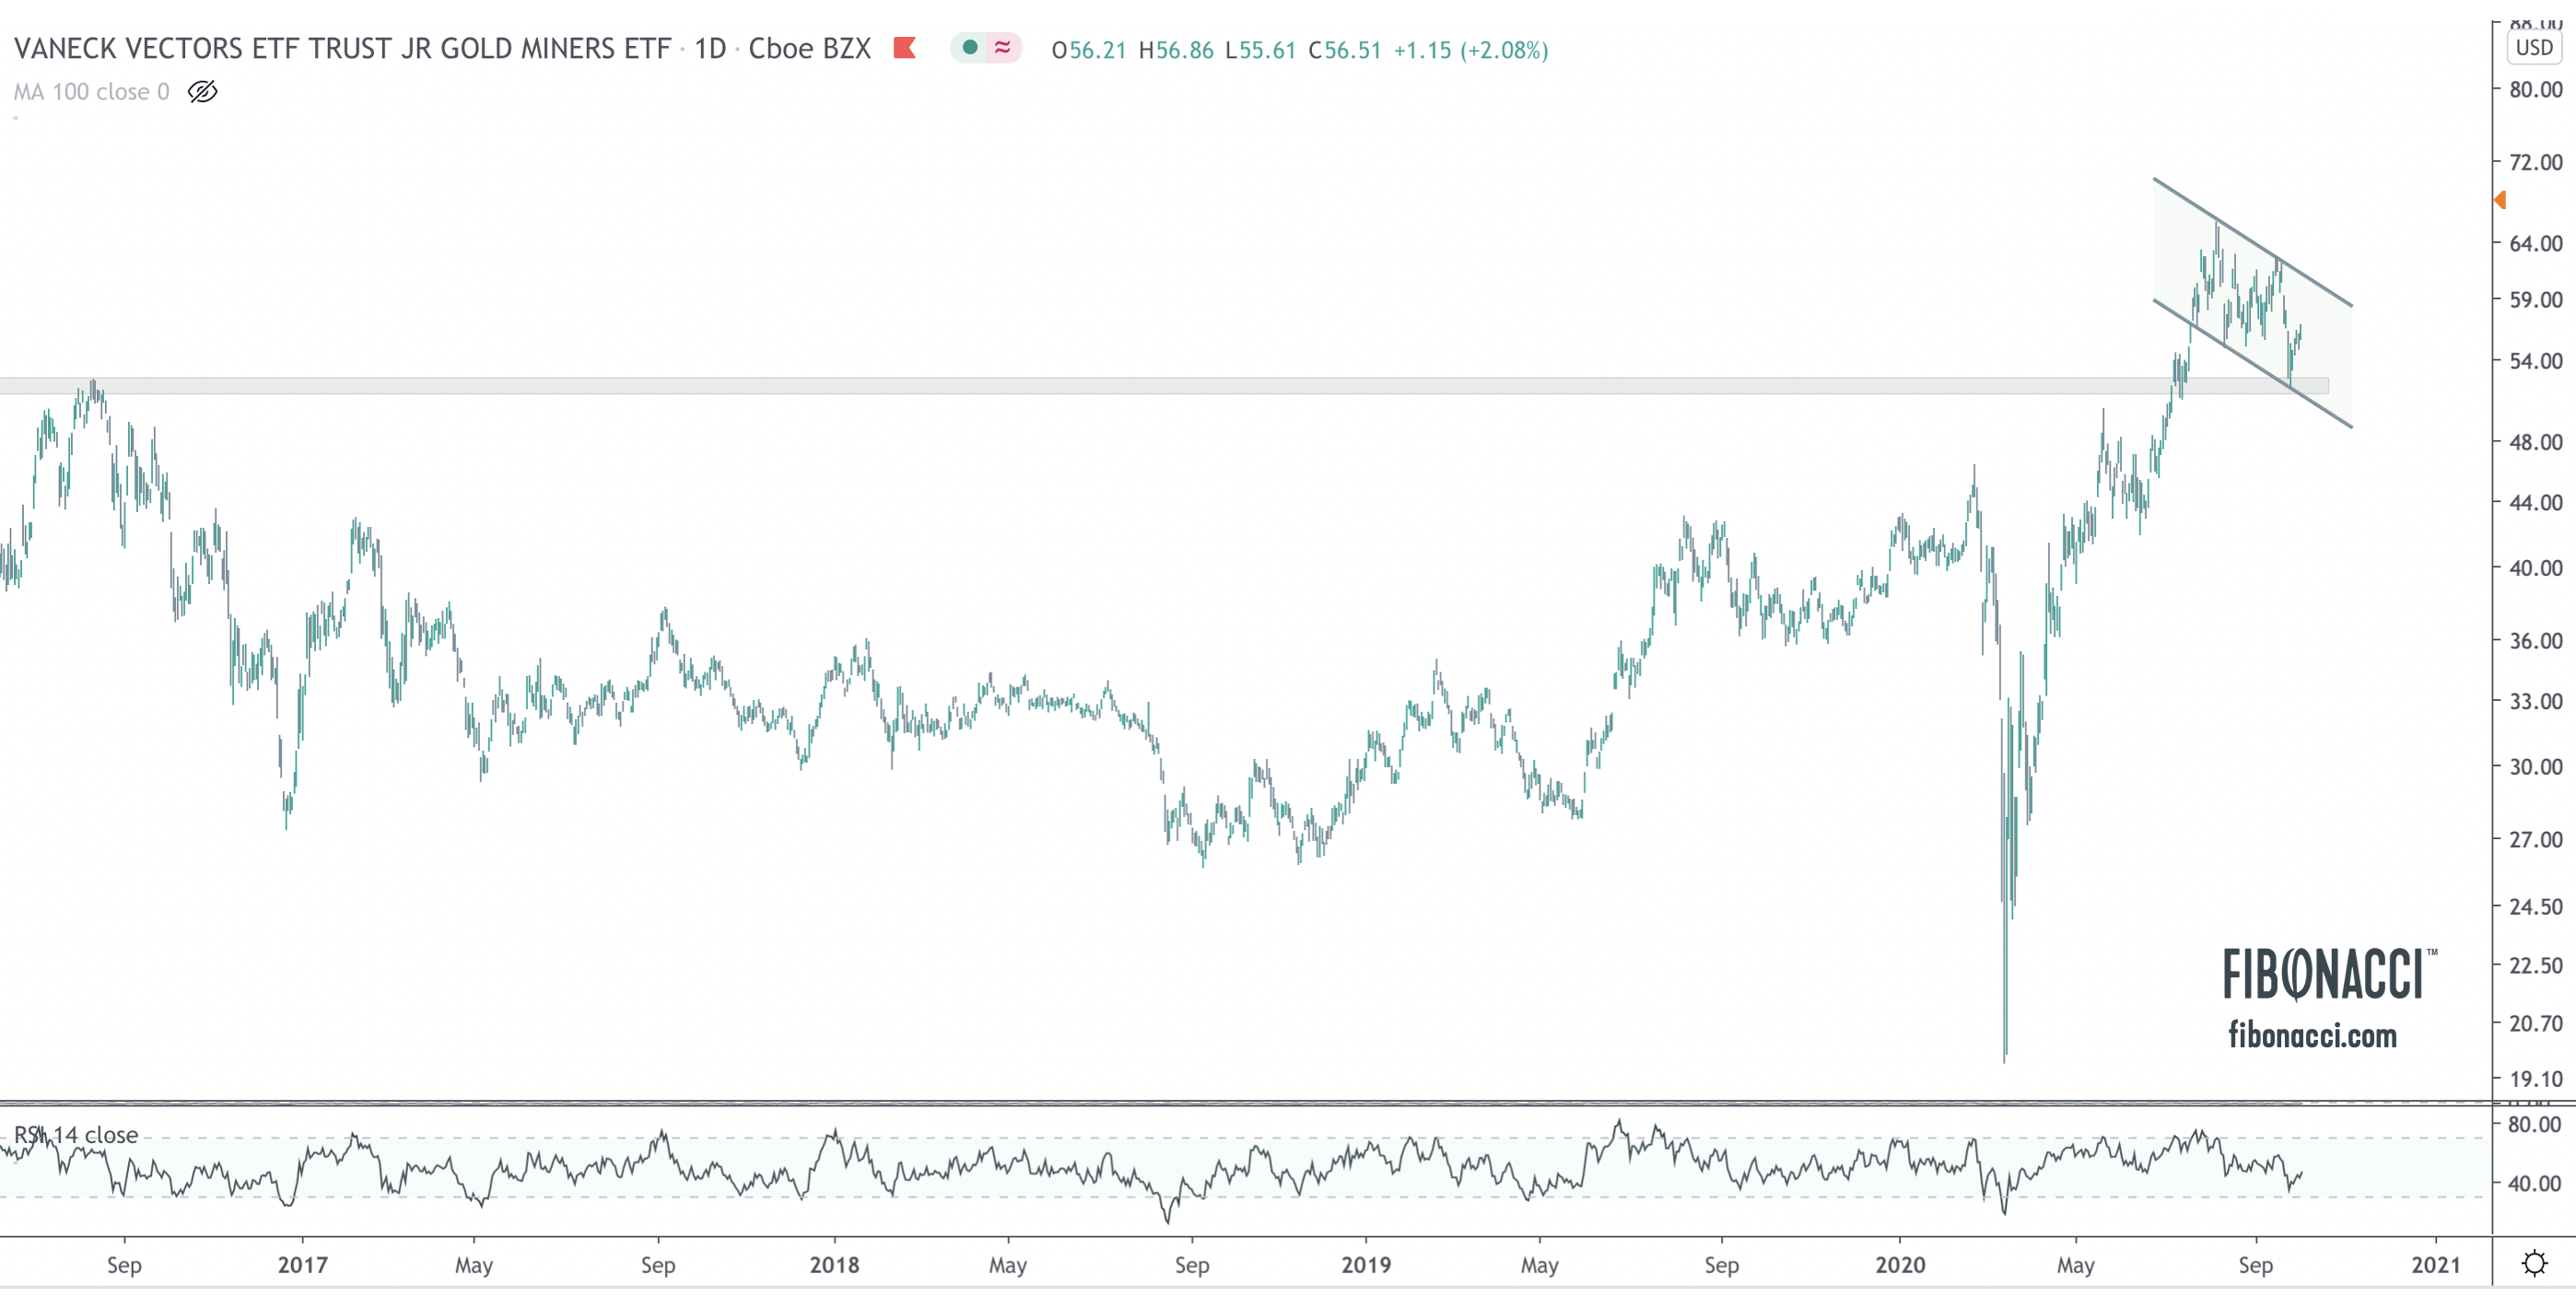
GDXJ – Junior Gold Miners ETF
The junior gold miners look even better than the majors. The entire selloff has been a simple retest of the breakout from the 2016 high. Like GDX, price has just been consolidating for 2-3 months and has formed a bull flag into support. RSI never got oversold during the selloff. Bulls want price to stay above 52.
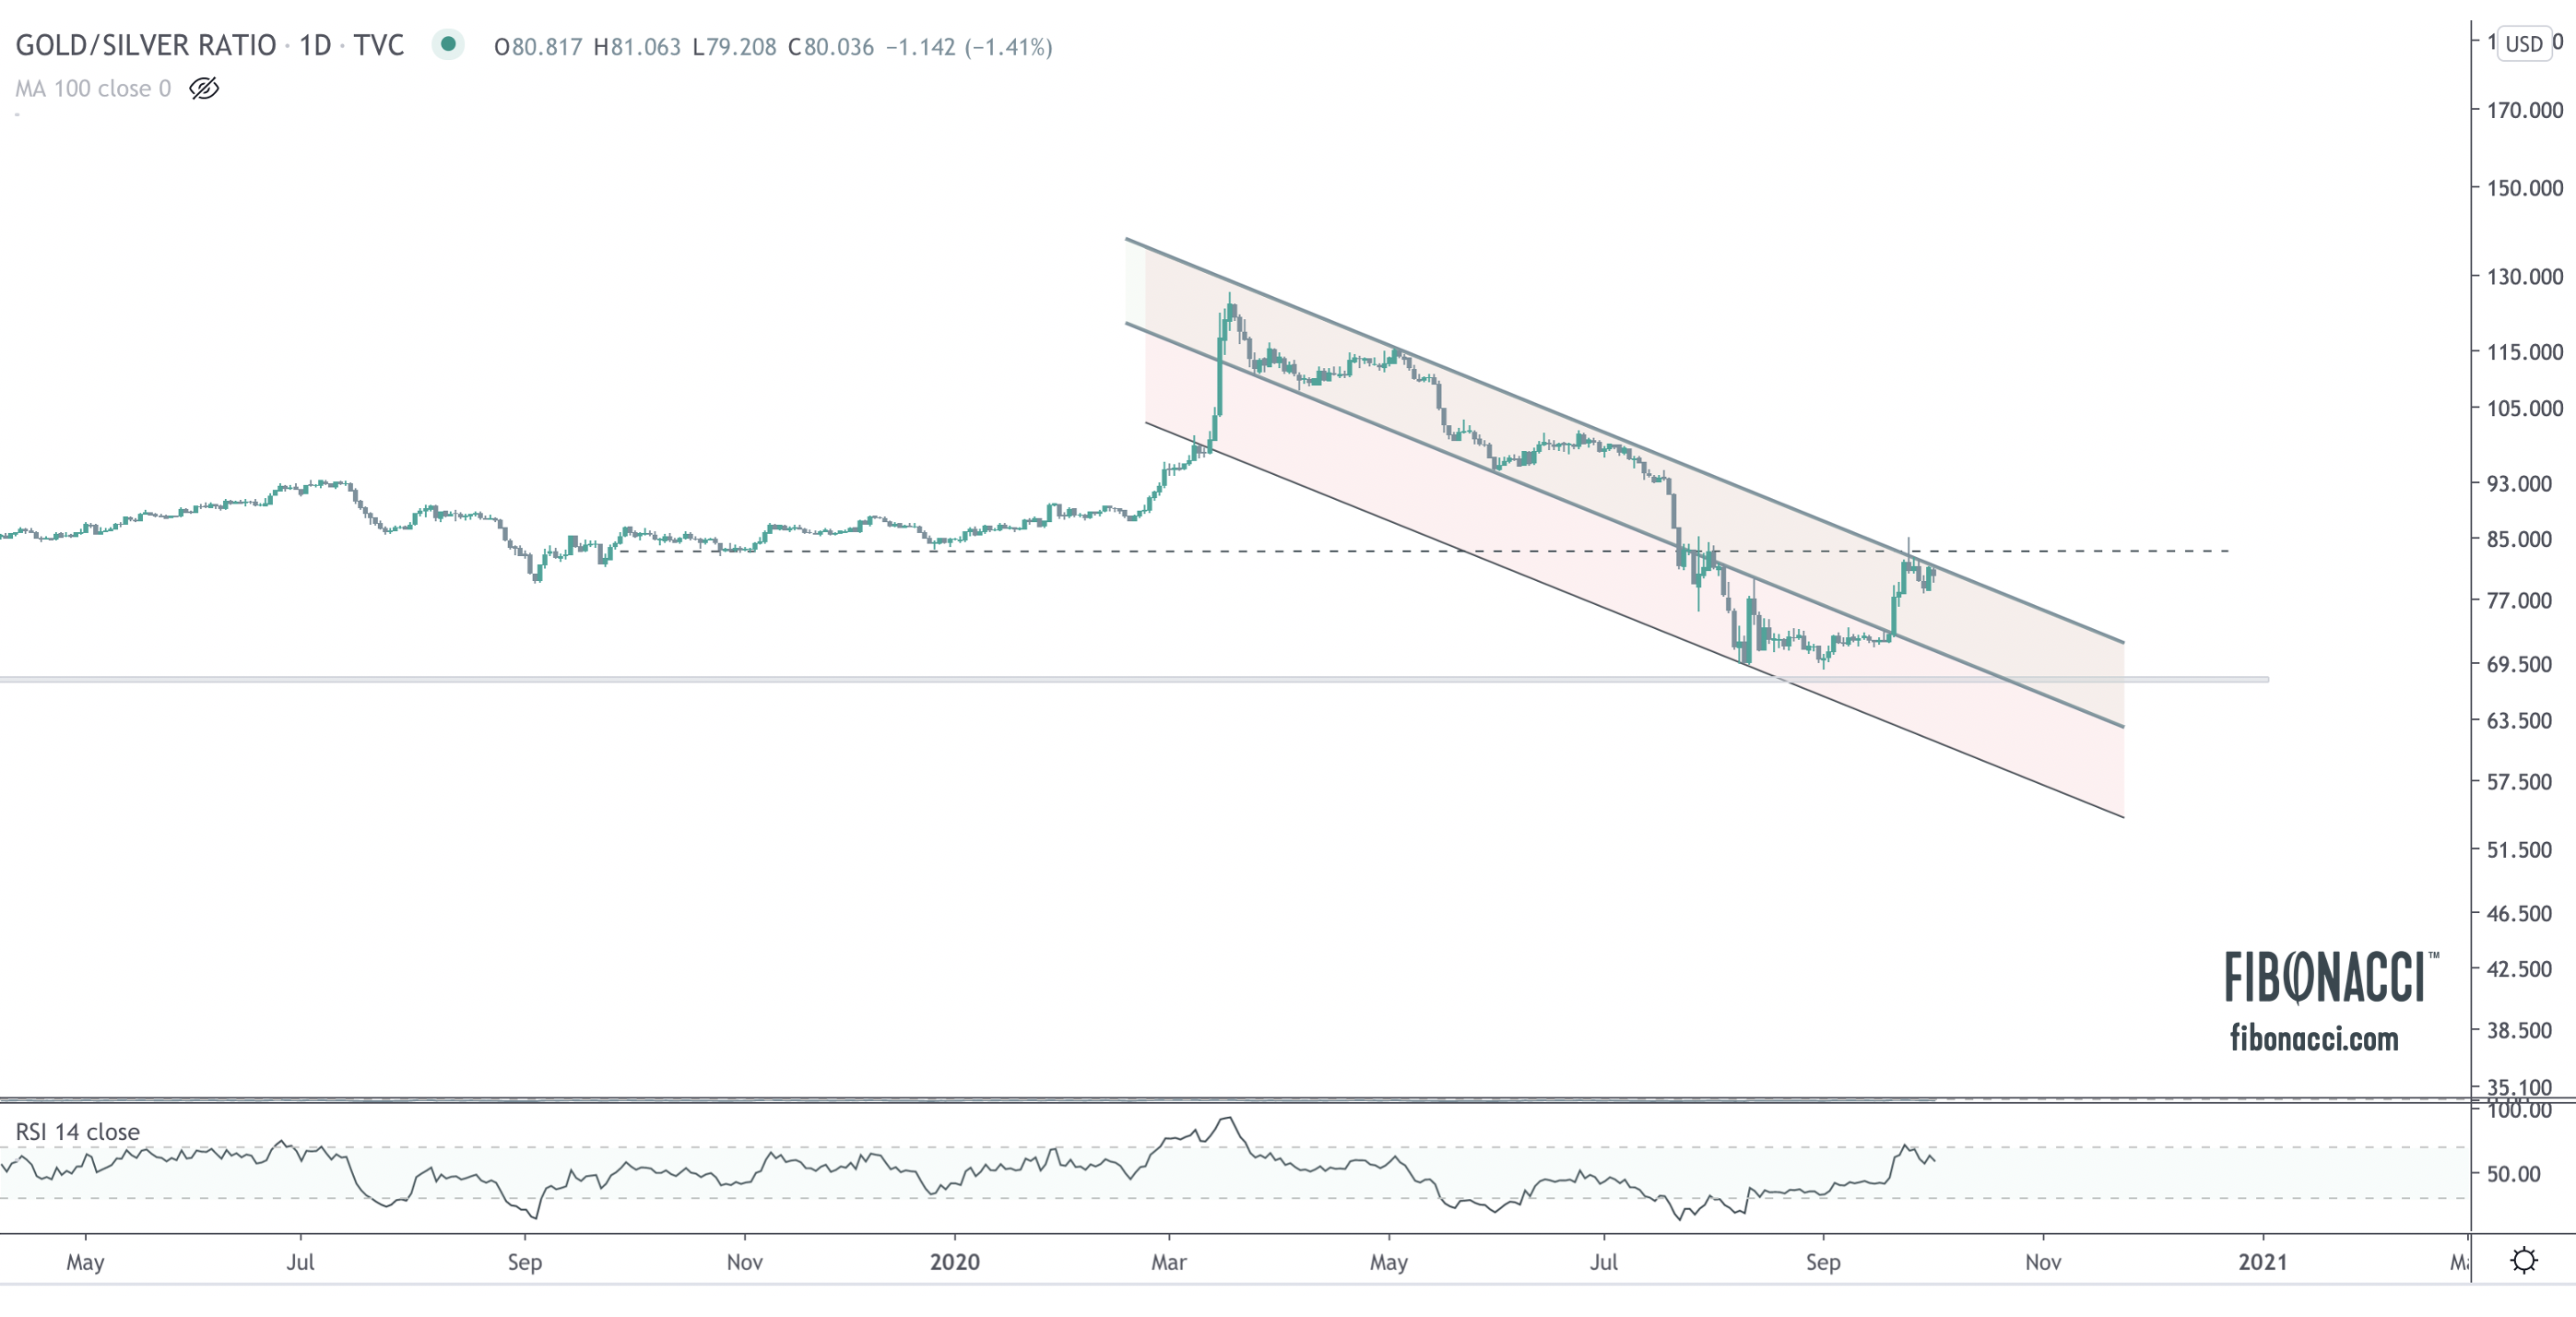
GOLD/SILVER RATIO
In a bull market, we want to see silver outperforming gold on a relative basis, which implies a lower ratio. In the chart below, we can see that the trend remains down, and the ratio is pushing up against falling resistance. A breakout in price should send the ratio falling back towards a retest of the 68 level. In this case, we notice that the RSI was “oversold”, meaning the downward fall became extreme, and the pullback never hit overbought levels, which implies that the downwards pressure is prevailing. These signs indicate silver outperformance, which is far more prevalent when prices are rising than when they are falling. A breakout of this ratio would imply a skew towards risk off, which would be less bullish generally.
As always, we would love to hear your feedback.
Gold Breaks Out; Silver Gearing Up for a Move
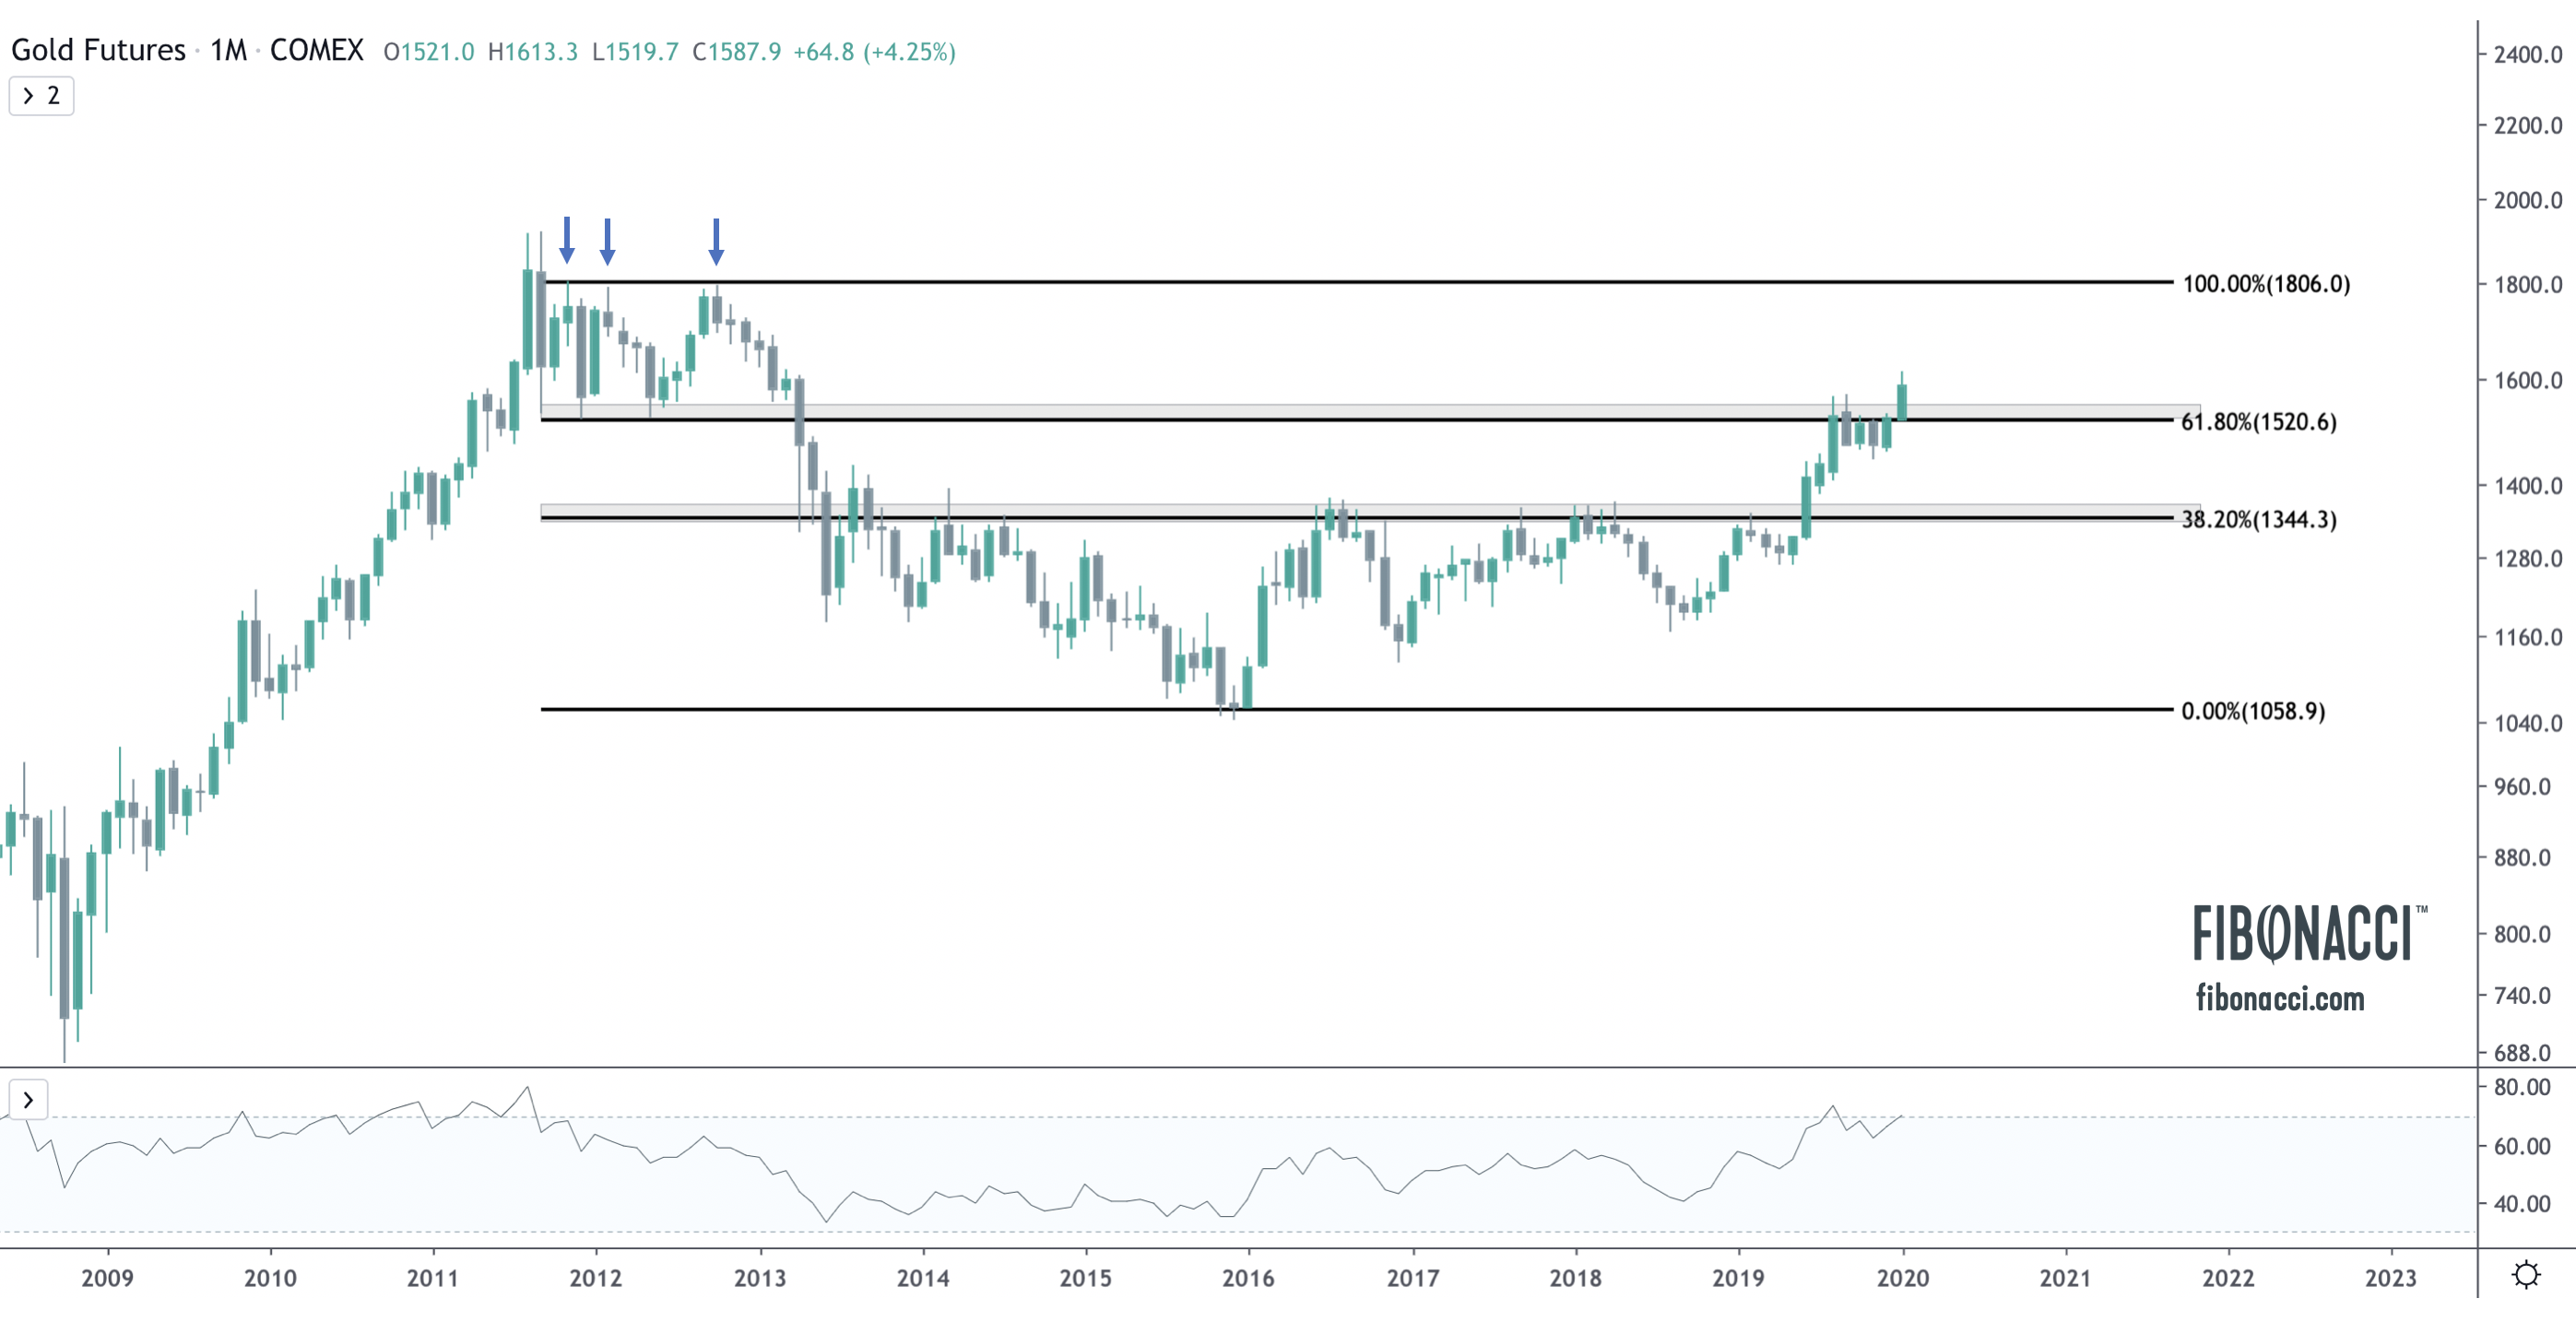
Gold bugs should be pleased with the monthly performance of gold in January. The definitive monthly break of the $1520 level, which had acted as strong monthly support six times between 2011-2013, before serving as resistance during this recent consolidation period between August and December, has sent a bullish longer term signal to the market.
Bullish Tailwinds in US Housing
In this video, I review key technicals in the US housing market, specifically the real estate ETF REZ, home construction ETF ITB, mortgage rates and lumber. I also explore some key demographic trends that could help fuel the rise in the US housing market.
As always, I hope this is helpful, and I welcome any feedback or questions.