Following weeks of low volatility, where the CBOE Gold Volatility Index fell to a decade low of 8.75, gold rallied $15 per ounce today to close at $1284. Simultaneously, the US dollar broke above heavy resistance (briefly) at 98. As the dollar goes, so go the metals.
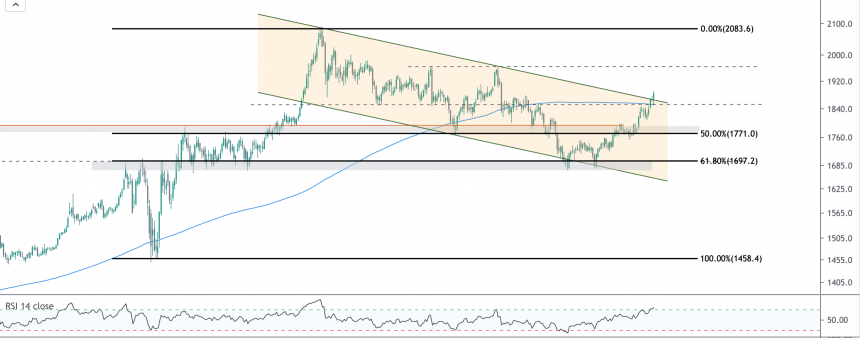
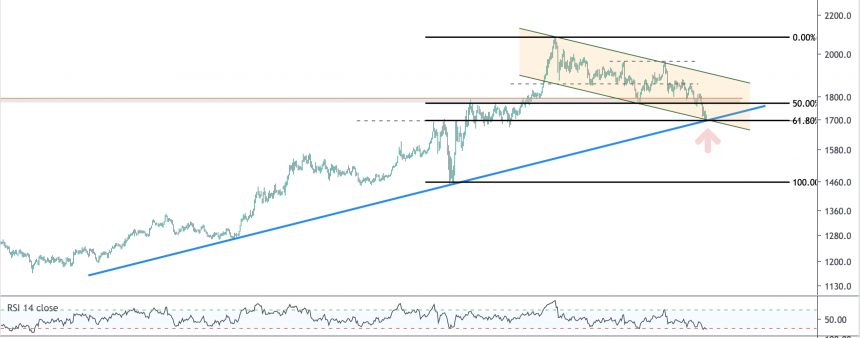
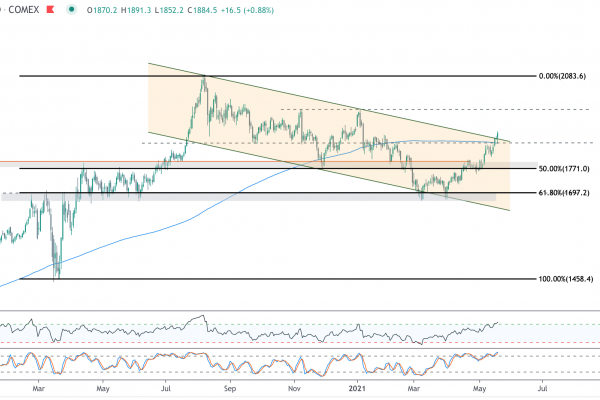
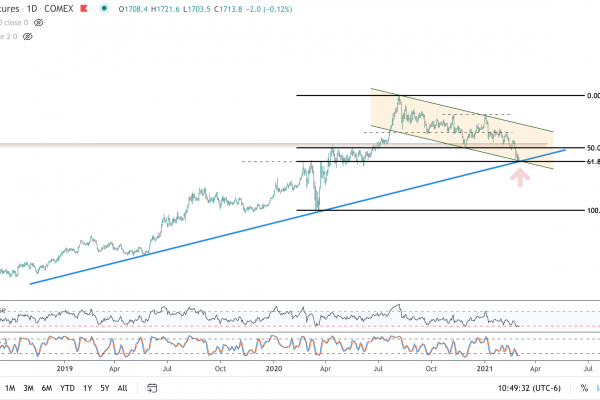
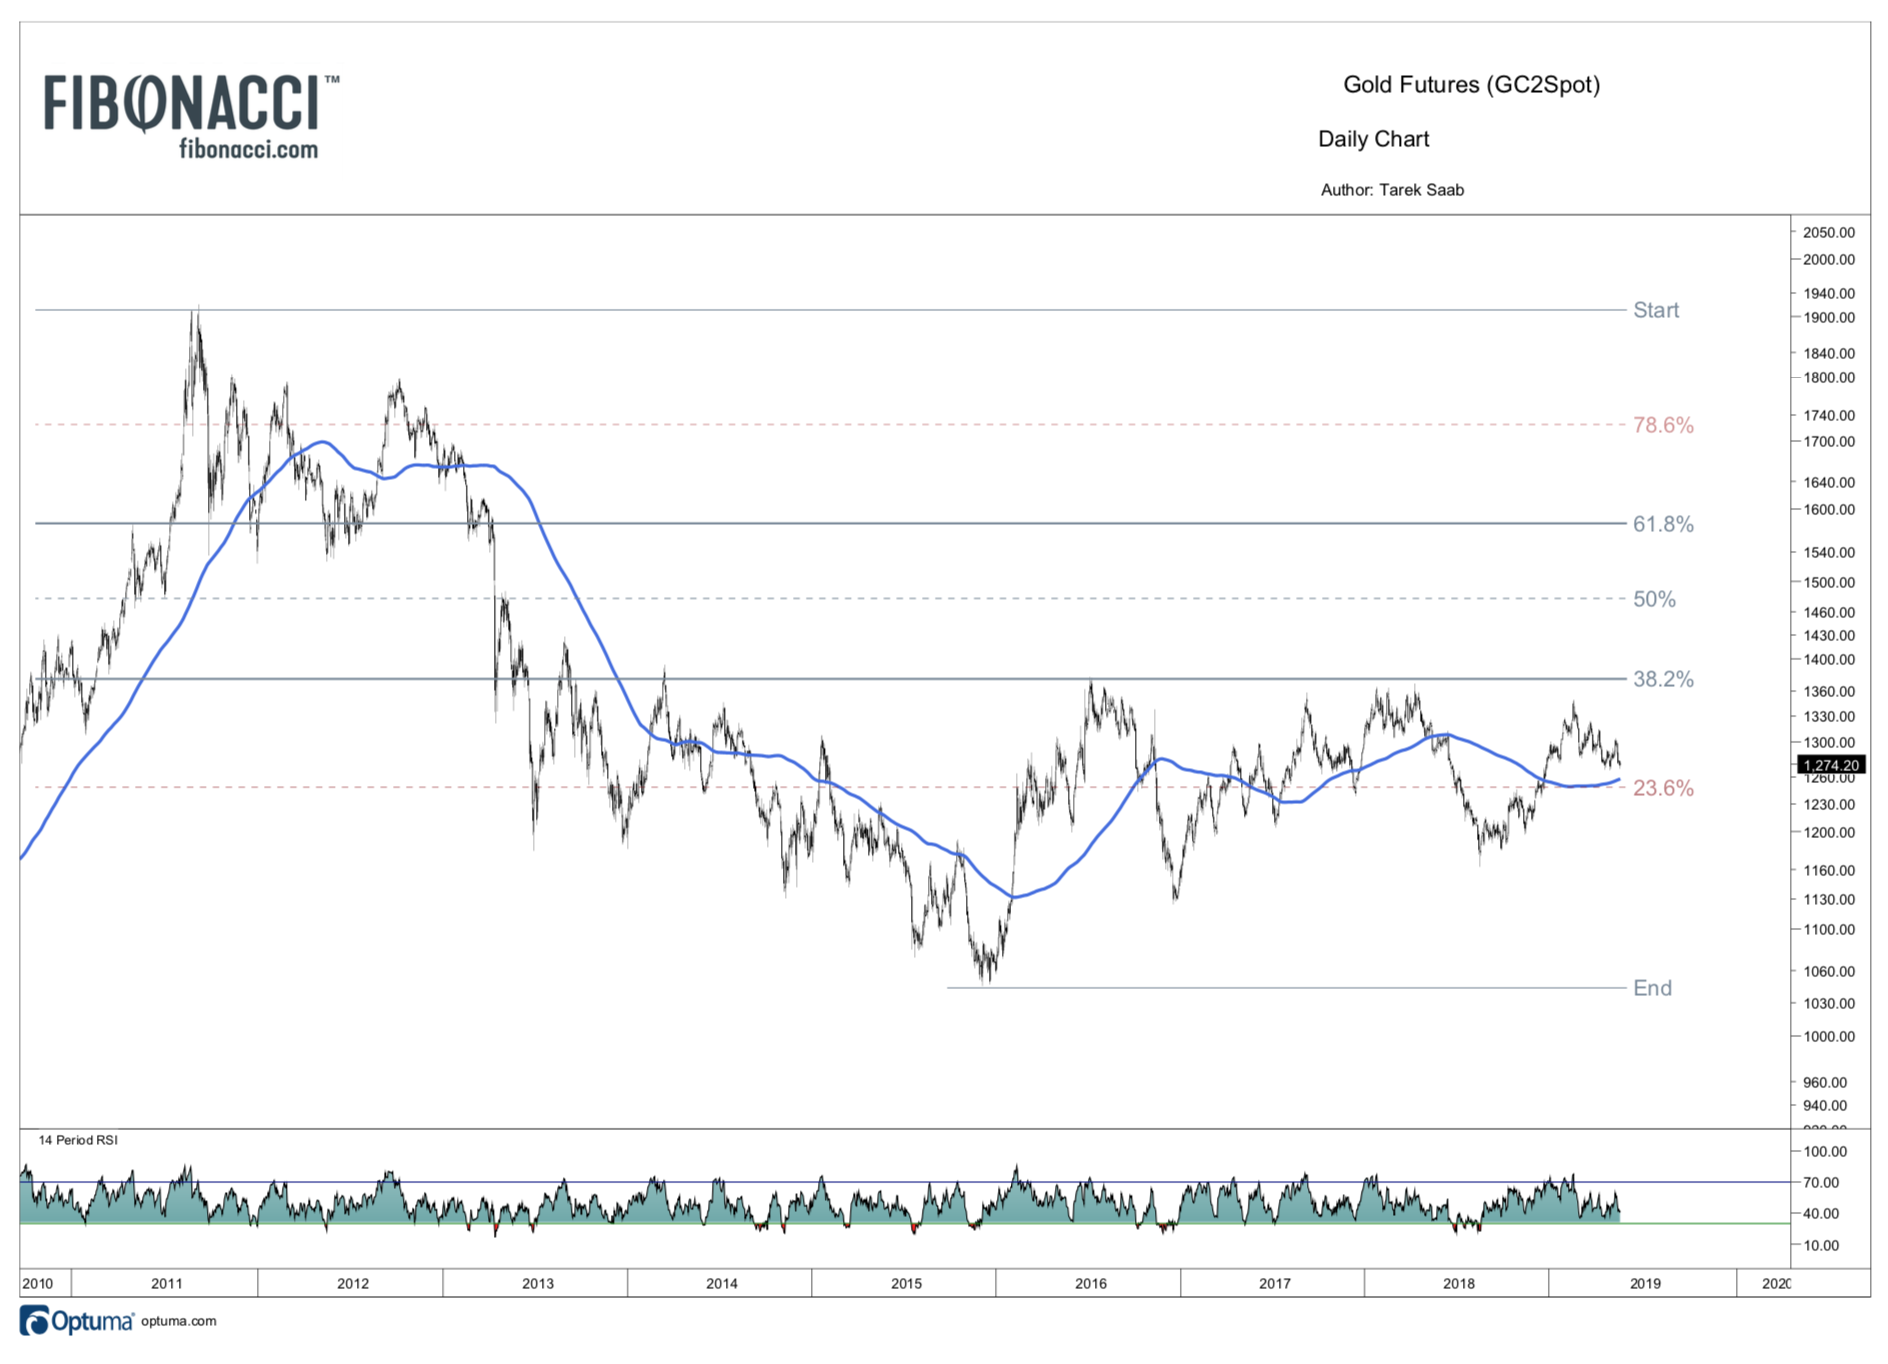
Gold has been forming a long, rounded bottom since 2013, and the chart looks constructive. The bull case for gold technically is that the price has remained above the 200 day moving average for the entirety of 2019, and the 200 DMA is now turning up. Gold also pushed into overbought territory on the Relative Strength Index (RSI) earlier this year, and as not oversold, which indicates that gold still has positive momentum.
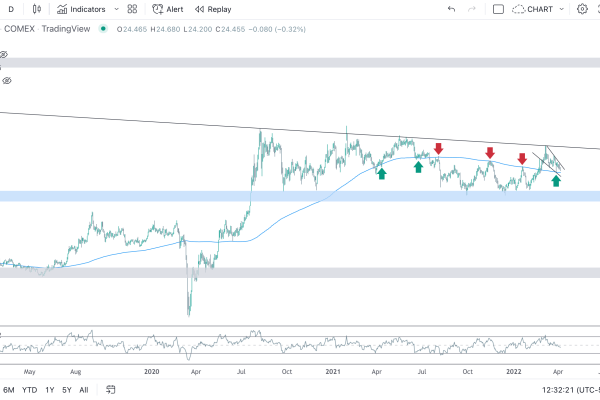
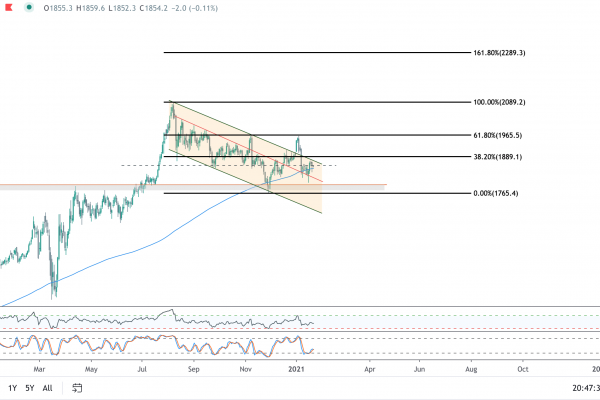
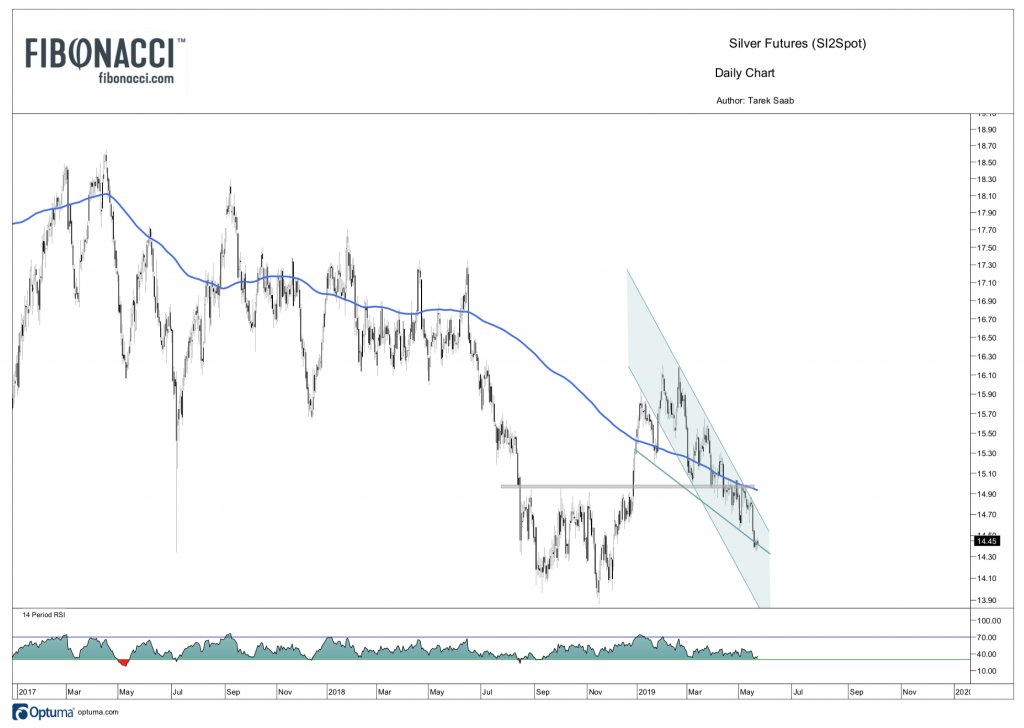
The bear case is that gold has struggled to push through the 38% Fibonacci retracement from the 2011 highs to the 2015 lows, and remains stuck in a multi-year triangle. Silver has also failed to confirm, as demonstrated in the chart below. Silver’s weakness seems coupled to the base metals sector, which has sold off as part of a global slowdown. Silver remains below its 200 day moving average, and while it fetched a bid today at trend line support, it still has some work to to do break out of the downward channel.
Charts Made with Optuma Software
The future for metals prices depends on the dollar index. A definitive breakthrough above 98 will likely put a ceiling on any intermediate rally.
Related Posts