Trend Remains Strong and Intact
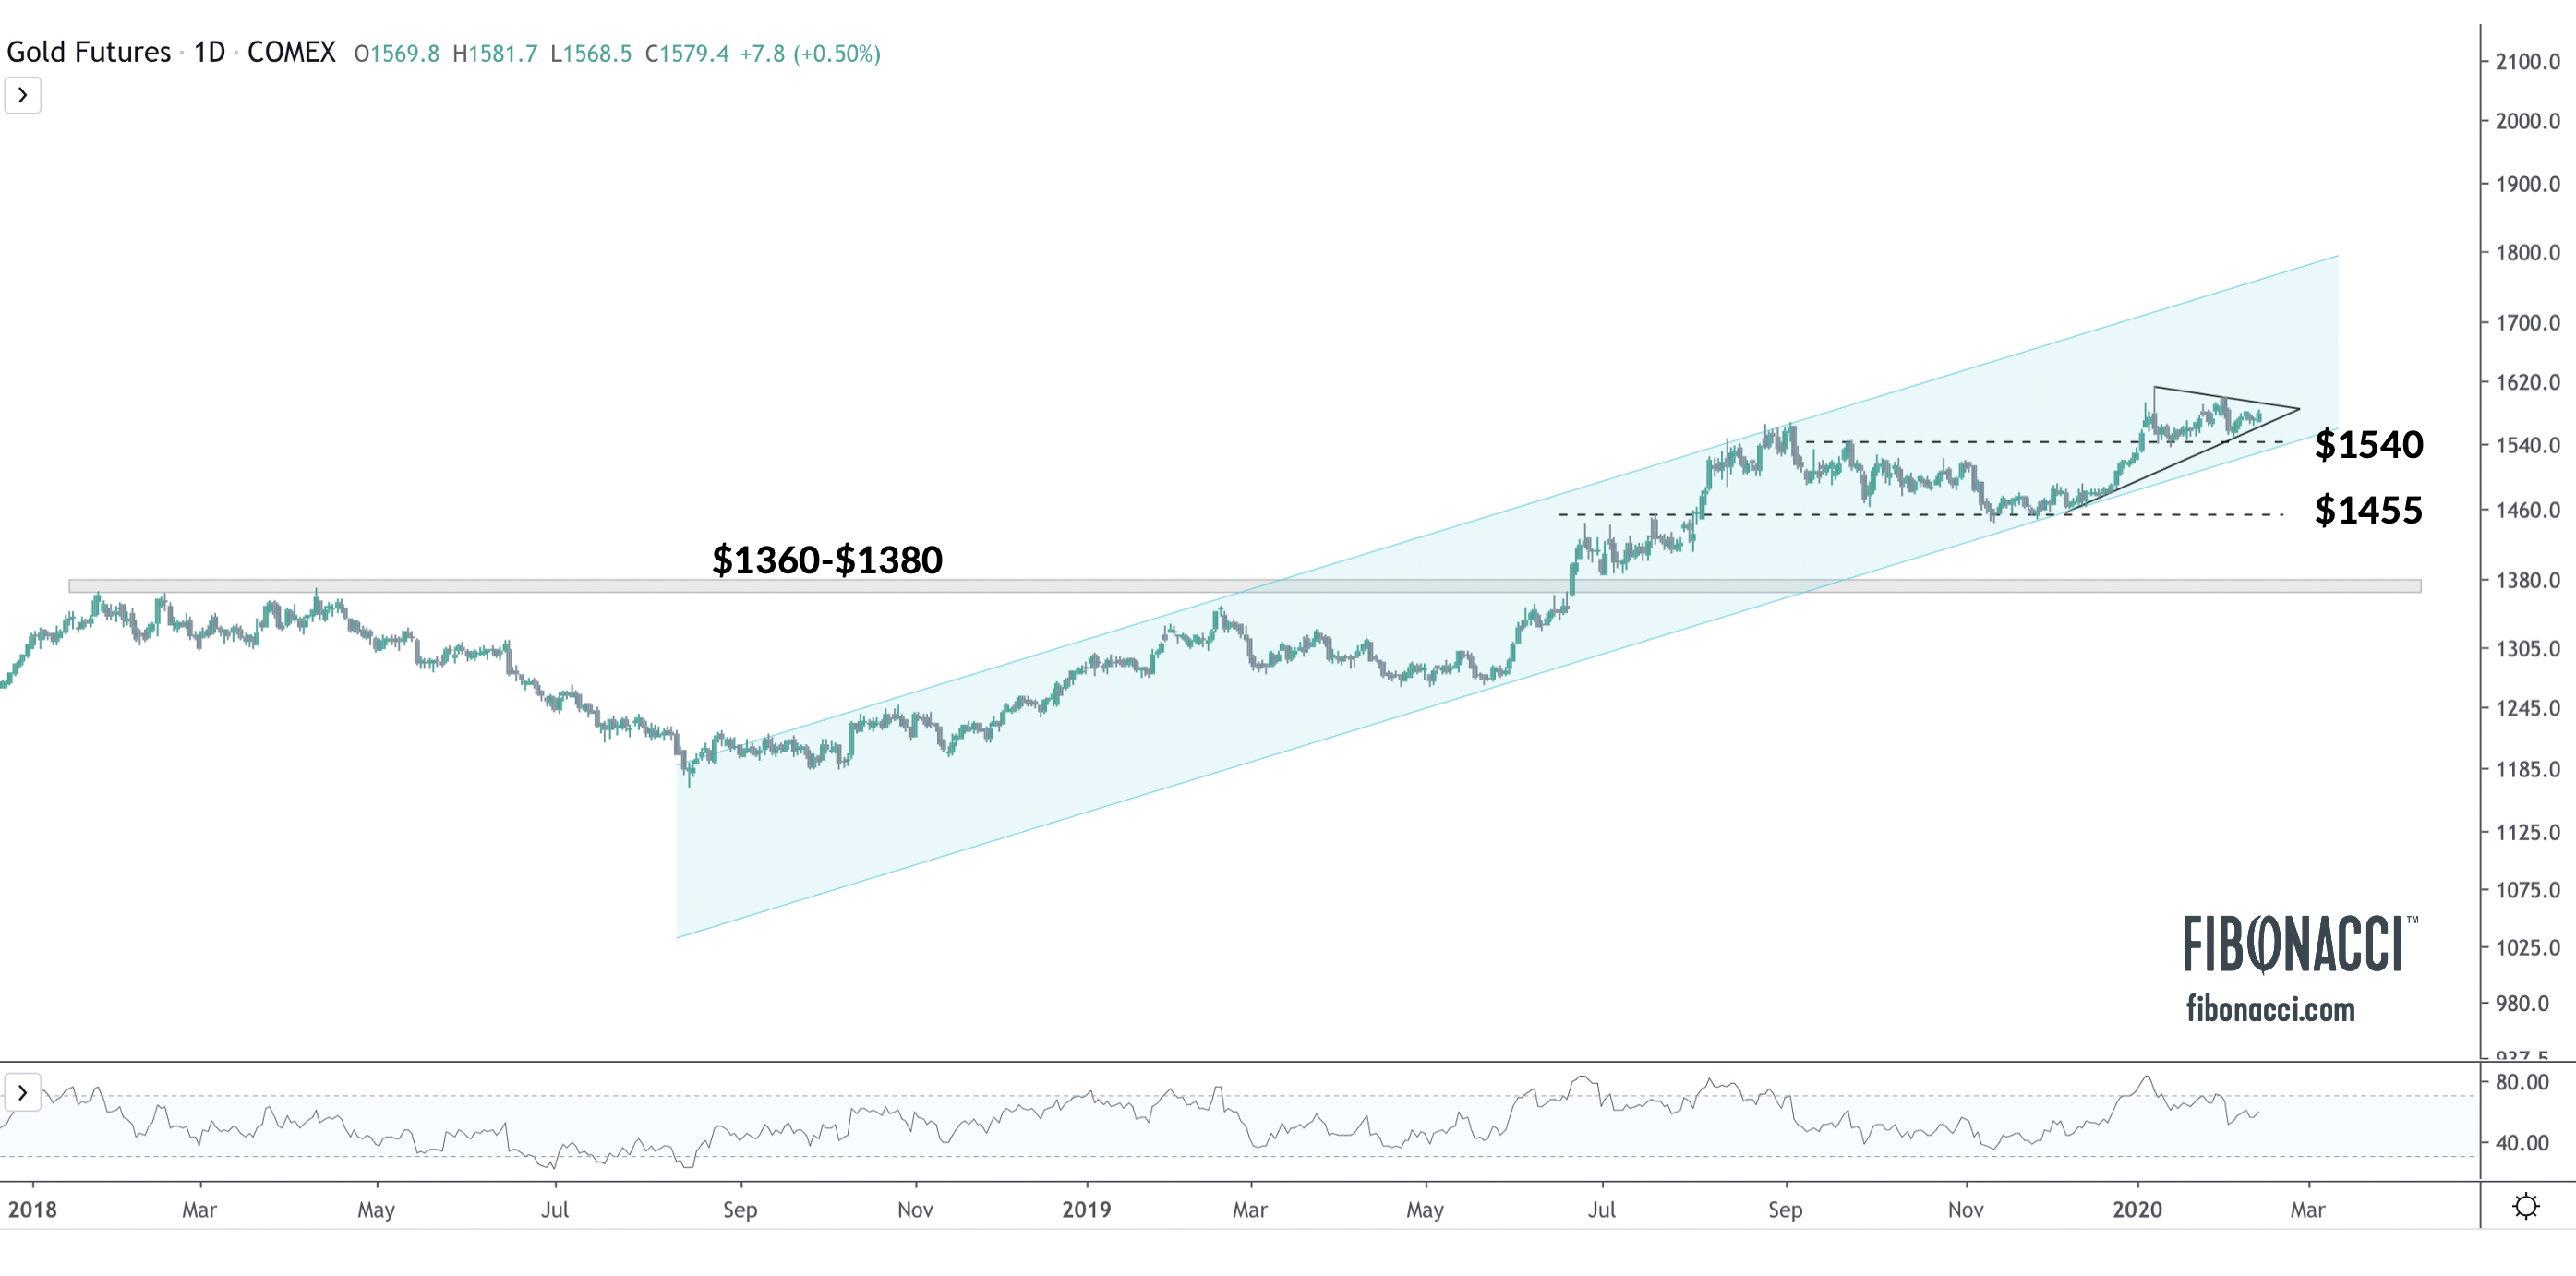
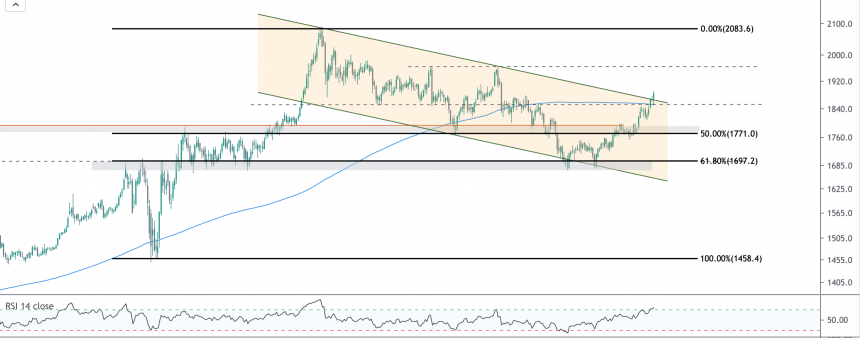
Price action in gold has traded in a narrow window over the past few weeks, winding into a tight coil as it begins to consolidate for another leg higher. The wave counts suggests that gold is in the early stages of a Wave 5. In the chart above, the key near term level to watch to the downside is $1540. This level served as resistance in September 2019, and has been support for the last month. This level also roughly coincides with rising support from the uptrend channel that commenced in August 2018.
A break of $1590 to the upside would represent a breakout of the symmetrical triangle gold has been forming since December 2019. The measured moved would imply a run to the top end of the channel around the $1750 level.
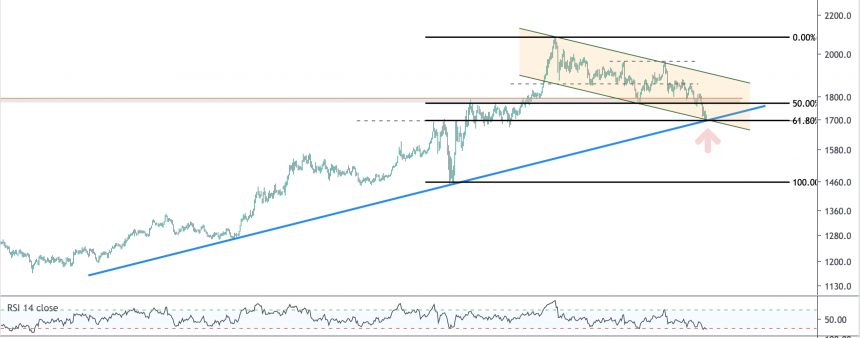
If gold breaks the $1530-40 level to the downside, it would likely fall swiftly back to support at $1450, at which point a full backtest of the six-year breakout at $1380 would remain in play. By all indications, this seems like the least likely scenario. Probabilistically, I think gold is more likely to break up from this coil, or at worst, retest $1540 before making a thrust higher.
As always, I hope this is helpful, and I welcome any feedback or questions.
Related Posts