Bullish Tailwinds in US Housing
In this video, I review key technicals in the US housing market, specifically the real estate ETF REZ, home construction ETF ITB, mortgage rates and lumber. I also explore some key demographic trends that could help fuel the rise in the US housing market.
As always, I hope this is helpful, and I welcome any feedback or questions.
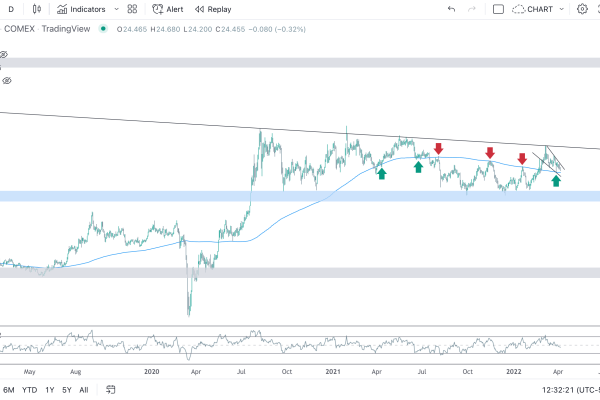
Silver Testing Key Level
Failed Breakout Disconcerting for Commodity Bulls
Dollar Movement Will be Key in 2020
Energy
Precious Metals
Currencies
Fixed Income
Equities
Price Prepping for New 7-Yr Highs?
Happy New Year! We are kicking off the New Year with stocks at all-time highs, oil prices spiking on Middle East tensions, and the precious metals complex following through nicely for our November/December videos. If you haven’t had a chance to watch those videos, they offer a helpful background on the technical setup for metals and the price action we are seeing today.
Resolution Coming in 2020?

The US dollar has frustrated bulls and bears for the past several years, as it has traded inside a historically narrow range without a clear long term directional bias. However, in both the near term and long term charts, it would appear a larger, secular move is coming.
Which Asset Class Will Outperform?
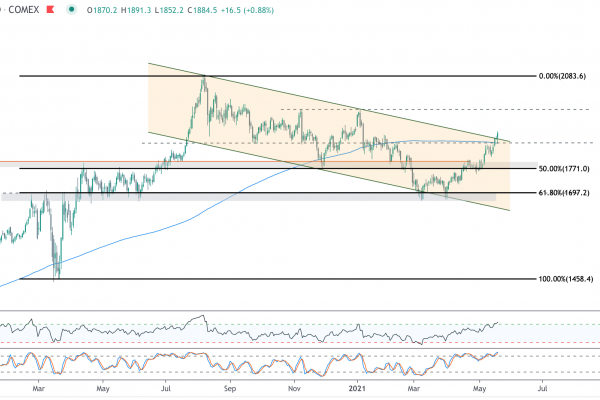
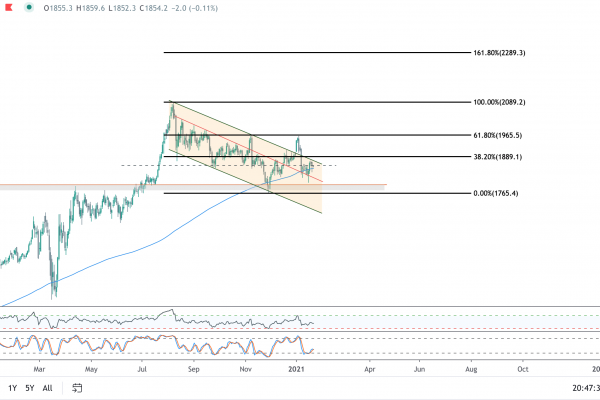
In advance of tomorrow’s Fed meeting and decision on interest rates, I am closely monitoring the S&P500 priced in gold. The S&P500 has broken out to all-time highs and has successfully retested the breakout, while gold has retreated ~$100 from its highs in August, either setting up a washout to a new near term bottom (possibly backtesting the entire breakout from $1380), or preparing for a rally to retest the $1580 level after a multi-month bull flag.
Mining Stocks Leading Gold Higher?
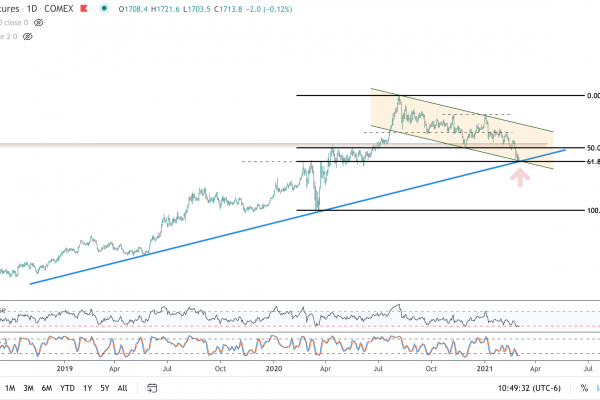
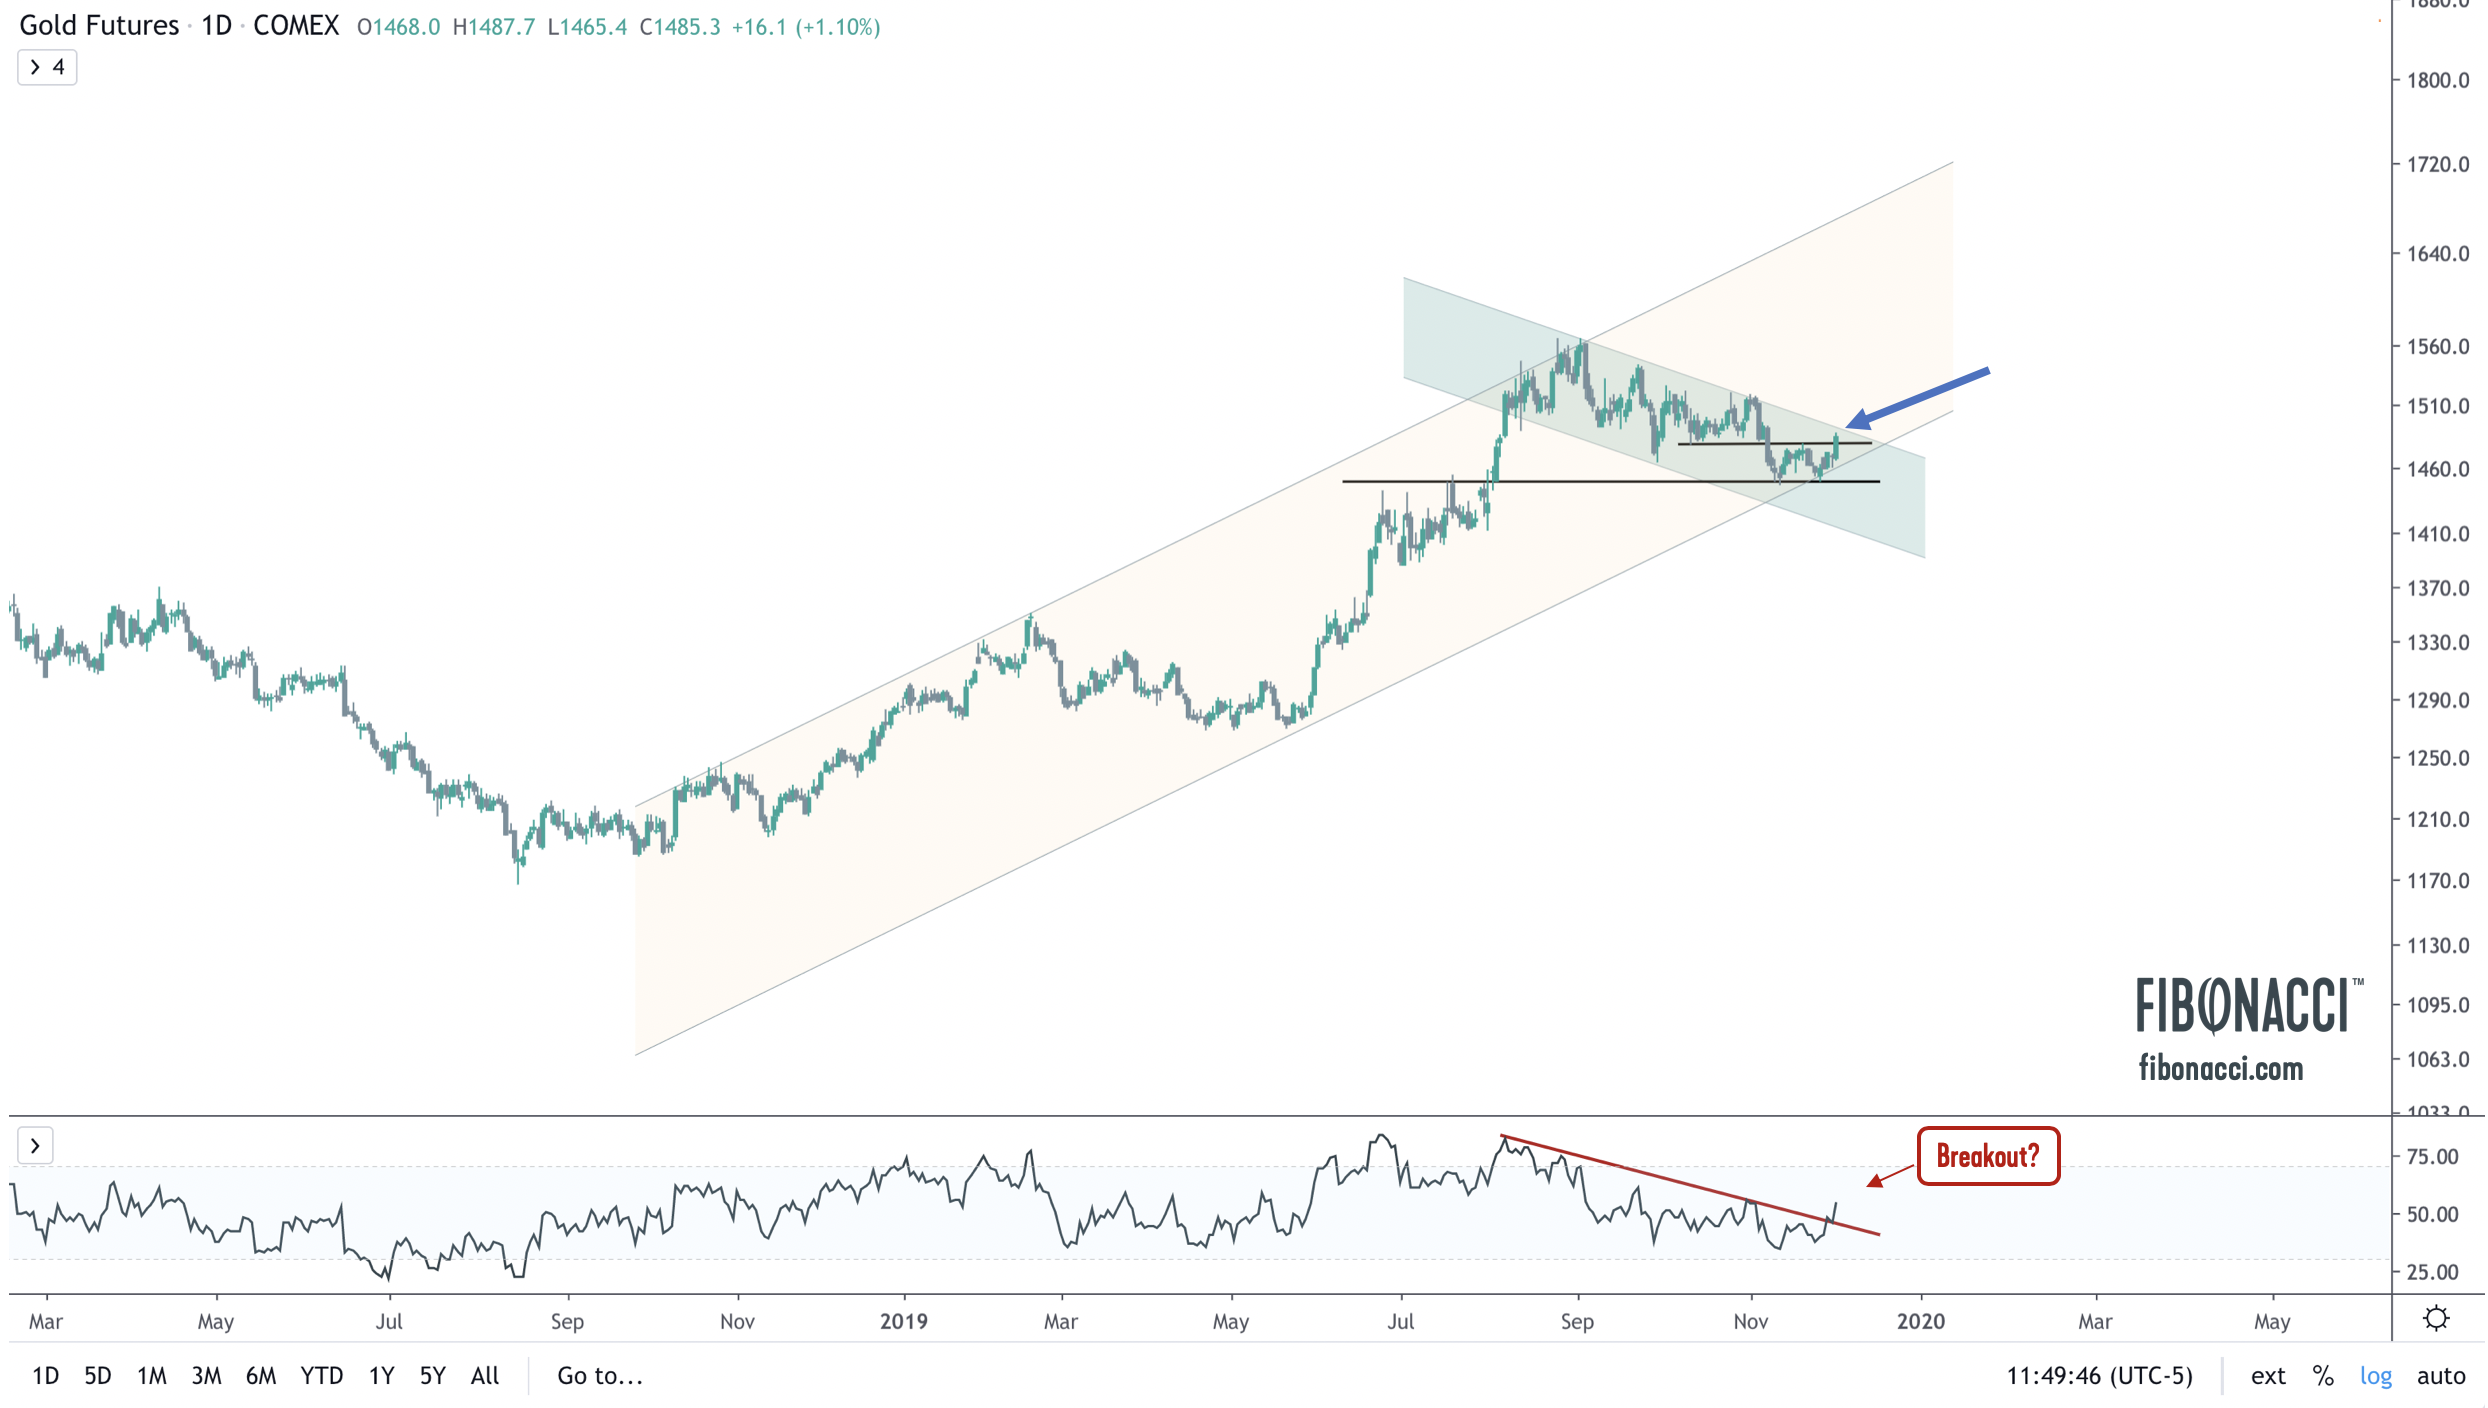
I produced this video on the gold and silver mining sector last night, and as of this morning gold is up significantly and all of the mining stocks continue to follow through. Gold (see chart above) just broke above horizontal resistance and is now looking to break up from the August downtrend channel. A move above $1495 would resume the uptrend from 4Q18, where channel support recently held. As presented in early November, I continue to believe this is a Wave 4 of 5, and that we will retest the highs at $1560-$1580. A close above $1495 would confirm it.
$GDX $GDXJ $ABX $NEM $XME $WPM $GOLD.V

The Monthly Close Above the 261.8 Fib Extension is Significant
The month of November was a significant expression of bullishness in the markets, as the S&P500 knifed through the 261.8% Fibonacci extension with a strong monthly candle close to new all-time highs. Taking a longer term view, the technical tailwind appears to be supporting a run to 4500+ to the 461.8% extension – nearly 50% higher. It is a number that would shock those who already view the market to be in bubble territory. While many are calling for a recession or an outright market crash, this interest rate supported, debt-fueled market shows underlying technical strength, and the US market remains the strongest globally. There has also been recent follow through among small caps and micro caps. The technical picture remains bullish.
However, per the chart above, I want to point out that we are now retesting a two-decade trend line that has acted as support and resistance eight times since late 1997, and is now being tested again. I suspect we may see a bit of a pause here and a likely pullback into the 3060 zone in the coming weeks. Stocks are overbought on the daily RSI, which is encouraging long term, but likely a signal that we could see some softness before the next leg higher.
If you’re looking for a buy signal, a weekly close above the long term trend line should signal that the thrust to the 461.8 extension is underway. Conversely, a significant correction and monthly close below the 261.8 fib extension could indicate the November move was a false breakout. We are at a great juncture for establishing a favorable risk/reward setup right around this long term trend line and fib extension.
Bitcoin Remains Above Long Term Trend line
In this video, I analyze the Bitcoin chart. Opinions on bitcoin tend to be very polarized; some believe bitcoin will rise to over $100,000 per coin, or even a million dollars. Others believe bitcoin is headed for zero and into the dustbin of history. In this video I try to take a balanced view and simply look at the long term chart and where price is trending. I overlay this chart with Fibonacci and Elliott Wave analysis to arrive at the conclusion that bitcoin is still very much in a long term uptrend.
What do you think? We’d love to hear your feedback.
S&P500 Meeting Up with Long Term Resistance
In this video, I analyze the S&P500 chart, which is now meeting up with 20-year long term resistance and the upper bound of its year long channel, but is also breaking out above the 261.8% Fibonacci extension from the 2007 peak to the 2009 bottom in equities. My short term view is bearish, as I think overhead resistance is stout and the RSI is overbought. However, longer term, the break above the 261.8% extension is significant and supportive of higher equity prices in the coming months.
Gold Price – Breakdown, or Another Leg Higher?
Picking up from last week’s video, I wanted to do a deep dive into gold, particularly because there is a diversity of opinions regarding whether we break down from here or we make another leg higher. In this video, I address a recent chart from JC Parets at All Star Charts and my opinion regarding his analysis in the short term.
The big question is whether gold has completed a fifth wave from the $1170 low (setting up and A-B-C correction), or whether the recent high was only wave 3, setting up a fifth wave higher. I am of the latter opinion.
As always, we would love to hear your feedback whether you agree or disagree.