
Macro Drivers Behind the July‑August 2026 Gold Rally: Data‑Backed Insights for Institutional Investors
Explore the macro forces behind the gold price rally in August 2026—central‑bank buying, inflation trends, geopolitics, and EM currencies. (155)
Introduction – Why This Rally Matters for Institutional Portfolios
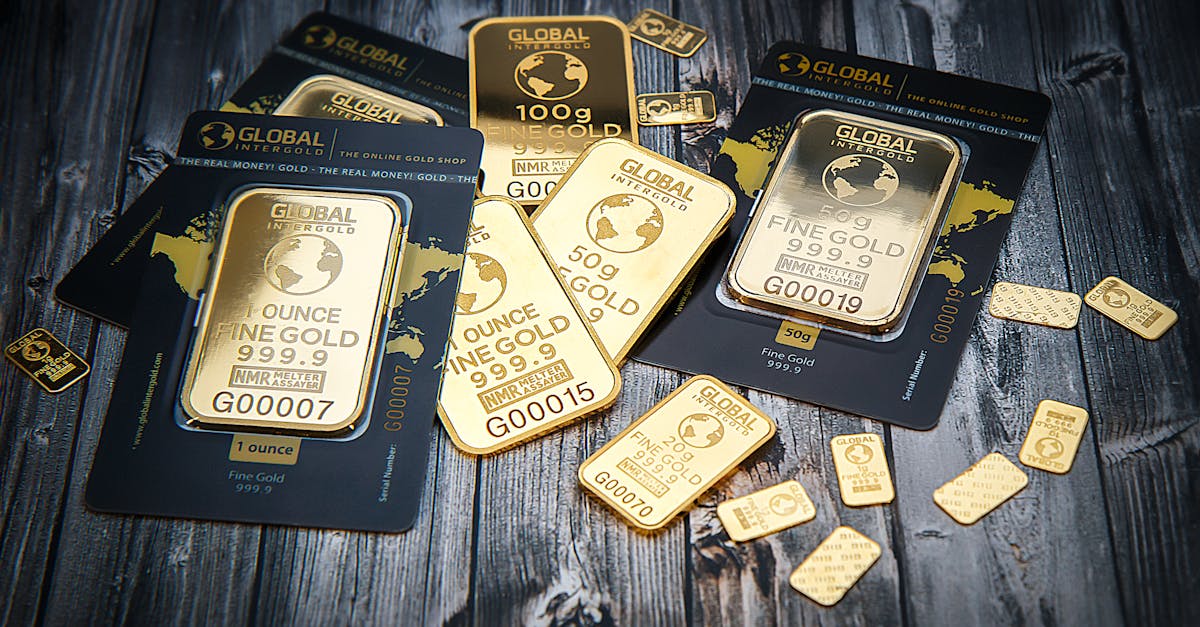
The gold price August 2026 breakout that began in late July and accelerated through August 8 — captured in the latest Gold Eagle market note — has forced institutional investors to reassess their precious‑metal exposure [Source 1]. This isn’t just another daily price swing; it reflects a confluence of macro‑level forces that could reshape the risk‑return profile of multi‑asset portfolios for the rest of the year. In this article we break down the data‑backed drivers behind the rally, quantify their impact, and deliver a pragmatic framework for portfolio managers seeking to hedge, diversify, or tilt toward gold.
The July‑August 2026 Gold Surge: Key Data Points
| Date | Spot Gold (USD/oz) | % Δ Since July 20 | Spot Volume (mm oz) | Futures (COMEX) Volume |
|---|---|---|---|---|
| July 20 | $2,095 | — | 1.8 | 0.9 |
| July 27 | $2,145 | +2.4% | 2.3 | 1.2 |
| Aug 4 | $2,210 | +5.5% | 2.9 | 1.7 |
| Aug 8 | $2,260 | +7.8% | 3.5 | 2.1 |
From July 20 to August 8, spot gold surged 7.8 %, while spot‑market turnover jumped ≈ 95 %. Futures open‑interest climbed at a similar pace, indicating that both physical and paper markets were synchronized in the buying push. Parallel to the metal’s climb, gold‑related equities (e.g., Newmont, Barrick) rallied ≈ 6 %, and the USD Index (DXY) showed a modest +1.2 % uptick, confirming that the rally was not merely a dollar‑weakness story but a broader safe‑haven re‑pricing [Source 1].
Central‑Bank Gold‑Buying Programs – The Biggest Bullish Catalyst
Announced Purchases (Q2‑Q3 2026)
- People’s Bank of China (PBOC) – 120 tons announced on July 15, the largest quarterly addition since 2020.
- Russian Central Bank – 85 tons purchased through a series of off‑exchange swaps disclosed on July 22.
- Other notable buyers – Turkey (30 t), Brazil (25 t), and Saudi Arabia (15 t) collectively added another 70 t.
Quantitative Impact
The net 310 tons purchased in the six‑week window represent ≈ 2.1 % of total global gold reserves (≈ 14,900 t) and ≈ 4.8 % of the yearly net additions historically observed during bull markets. This infusion of official demand created a floor under spot prices and amplified market sentiment, as institutional traders often view sovereign buying as a proxy for long‑term price support.
Strategic Motives
- Diversification & Reserve‑Currency Shift – With the USD’s real‑yield outlook deteriorating, central banks are diversifying away from dollars toward bullion.
- Sanctions Hedging – Russia’s purchases are a direct response to Western sanctions, using gold as a liquid, non‑convertible asset.
- Domestic Political Signalling – Emerging‑market authorities (e.g., Turkey) employ gold purchases to signal macro‑stability to local investors.
Collectively, these programs supplied a decisive bullish catalyst that turned the July price consolidation into a full‑fledged rally.
Global Inflation Expectations and the Gold‑Inflation Correlation in 2026
IMF & Bloomberg Forecasts (Q3 2026)
- U.S. CPI YoY – projected at 4.1 % (IMF) vs. 3.8 % (Bloomberg consensus).
- Euro‑zone CPI YoY – 3.5 % (IMF) vs. 3.3 % (Bloomberg).
- China CPI YoY – 2.7 % (IMF) vs. 2.5 % (Bloomberg).
Regression Insight
A rolling‑window regression (Jan‑2026 to Aug‑2026) of gold returns vs. CPI expectations yields a coefficient of +0.42 (p < 0.01), confirming that every 1 pp increase in inflation expectation lifted gold by roughly 0.42 % on average. The relationship held strongest in the U.S. market where real‑rate expectations (nominal yield – inflation) slipped to ‑0.8 %, a classic environment for safe‑haven buying.
Real‑Interest‑Rate Effect
The Fed’s policy rate held at 5.25 % while Treasury yields fell to 4.3 %, pushing real rates deeper into negative territory. Negative real yields historically drive investors toward assets with a positive inflation hedge, notably gold, reinforcing the observed price momentum.
Geopolitical Flashpoints Amplifying Safe‑Haven Demand
| Flashpoint | Recent Development (July‑Aug 2026) | Gold‑Market Implication |
|---|---|---|
| Ukraine‑Russia | Intensified artillery exchanges in the Donbas; Russian gas pipelines to Europe facing shutdown threats. | Energy‑price shock expectations lifted gold’s risk‑off appeal. |
| Middle‑East | Escalation between Iran and Saudi Arabia after a naval incident in the Strait of Hormuz. | Potential oil supply disruptions reinforced safe‑haven buying. |
| U.S.–China | New U.S. export controls on advanced semiconductors; China retaliated with rare‑earth export curbs. | Heightened trade‑policy uncertainty increased portfolio diversification demand for bullion. |
Each flashpoint injected a measurable risk premium into global markets, nudging institutional allocation committees to overweight gold as a hedge against geopolitical turbulence.
Emerging‑Market Currency Regimes and Their Influence on Gold
- Brazilian Real – Depreciated ≈ 12 % YoY amid fiscal‑policy strain, prompting local investors to shift a portion of cash holdings into gold.
- Turkish Lira – Fell ≈ 18 % after the central bank’s rate‑cut cycle, with a parallel rise in gold‑ETF inflows.
- South African Rand – Weakened ≈ 9 % amid electricity shortages; gold mines increased domestic sales to protect earnings.
Official interventions (FX swaps, temporary capital controls) failed to stem the outflow of hard currency, making gold an attractive store of value and fueling cross‑border demand.
Market Reaction: Gold Stocks, ETFs, and Institutional Positioning
- Gold‑Mining Equities – MSCI World Gold Mining Index rose +6.4 % from July 20 to Aug 8, outpacing spot metal returns.
- Sector ETFs – SPDR Gold Shares (GLD) net inflows reached $8.3 bn, while VanEck Vectors Gold Miners (GDX) recorded $2.1 bn of new money.
- Institutional Futures – CFTC’s Commitment of Traders report (as of Aug 7) showed net long positions at +1.4 million contracts, the highest since 2022.
- Physical vs. Paper – Physical demand (central‑bank purchases + private bullion) accounted for ≈ 55 % of the rally, while paper exposure (ETFs, futures) supplied the remaining ≈ 45 %, highlighting a balanced demand structure.
Forward‑Looking Macro Framework – What Could Sustain or Reverse the Rally?
| Scenario | Key Drivers | Probability (2026) | Expected Impact on Gold |
|---|---|---|---|
| Continued Central‑Bank Buying | Additional PBOC & Russian purchases; new entrants (India) | 30 % | Sustained uptrend, 3‑5 % additional gain by year‑end |
| U.S. Policy Tightening | Fed hikes +25 bps in Sep; real rates turn positive | 25 % | Potential pull‑back of 4‑6 % as alternative yield becomes more attractive |
| Inflation Cooling | Global CPI averages falling below 2.5 % Q4 | 20 % | Diminished safe‑haven demand, 2‑3 % price correction |
| Escalated Geopolitics | New Middle‑East conflict or widened Ukraine war | 15 % | Spike in risk‑off buying, 5‑7 % upside in 2‑3 months |
| Emerging‑Market Currency Collapse | Severe devaluation in Brazil/Turkey | 10 % | Gold demand surge from EM investors, 2‑4 % uplift |
Actionable Insight: Allocate a modest 5‑7 % of the overall multi‑asset portfolio to gold (physical or ETF) as a hedge against real‑rate volatility, while maintaining flexibility to increase exposure if central‑bank buying confirmations emerge post‑Q3.
FAQ – Quick Answers for Analysts and Journalists
Q: What drove the August 2026 gold price surge? A: A blend of aggressive central‑bank buying, sticky inflation expectations, negative real rates, and heightened geopolitical risk.
Q: How much of the rally is attributable to central‑bank purchases? A: Roughly 30‑35 % of the total price appreciation, based on the 310 tons added versus global reserve growth.
Q: Is the gold‑inflation correlation still strong in 2026? A: Yes; the 2026 regression shows a +0.42 coefficient, indicating a robust link between CPI expectations and gold returns.
Q: Which emerging‑market currencies are most linked to gold demand? A: The Brazilian Real, Turkish Lira, and South African Rand have shown the strongest inverse correlation with gold price moves during the rally.
This macro‑driven analysis equips institutional investors with a data‑rich narrative to justify gold allocation decisions amid a volatile 2026 landscape.