
Crypto vs Global Equities: How Bitcoin Volatility Is Dampening Market Momentum
Explore why Bitcoin's sharp volatility is slowing global equity momentum, with correlation data, macro factors, liquidity insights, and allocation tips.
Introduction – Record Equity Gains Meet a Stagnant Bitcoin
In August 2026 the S&P 500 and MSCI World indices logged fresh all‑time highs, while Bitcoin barely moved, ending the month slightly in the red. This sharp divergence puts Bitcoin volatility at the centre of a broader debate: why is the world’s premier cryptocurrency unable to ride the equity rally, and what does that mean for both retail and professional investors?
Bitcoin’s Recent Volatility Profile
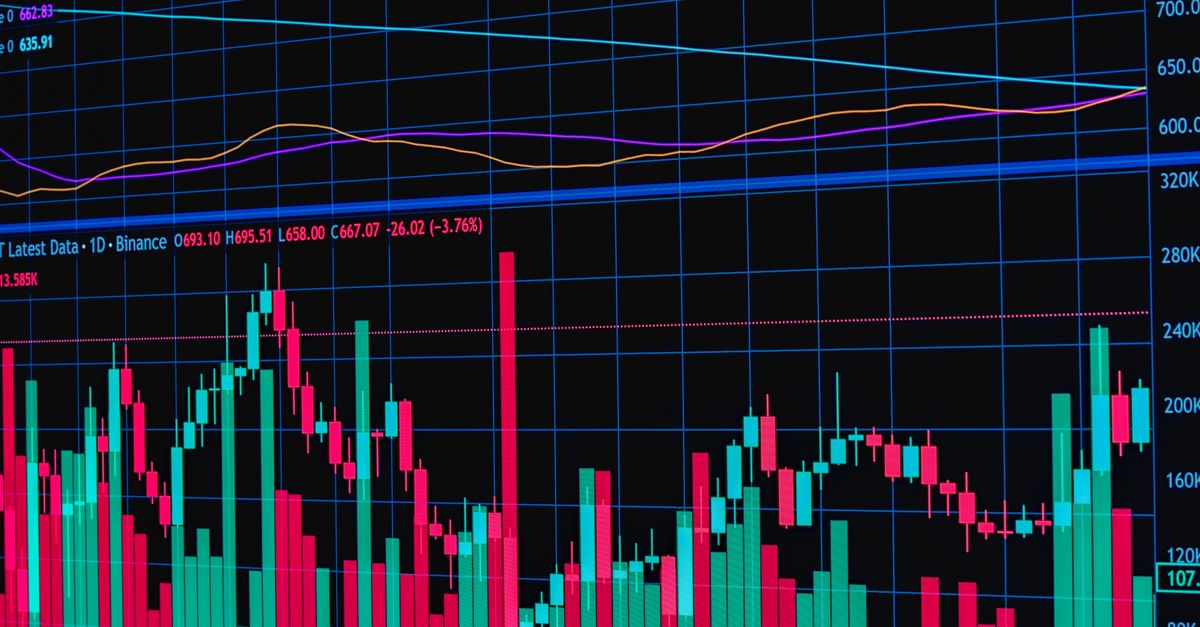
During Q2‑2026 the 30‑day average daily range (ADR) for BTC hovered around $1,200, and the 30‑day ATR (Average True Range) settled near $1,350 – roughly 3.5 % of the $38,000 price level. By contrast, the CBOE VIX averaged 16.8, and equity implied volatility (IV) for the S&P 500 hovered at 14.2. Bitcoin’s volatility curve spikes dramatically during events, such as the post‑Coldcard hack memory‑pool surge that sent the 30‑day ATR above $2,000 for a brief period. The data shows that BTC remains the most erratic asset class, far out‑performing traditional risk gauges.
Macro‑Economic Drivers Pulling Crypto and Stocks Apart
Tightening monetary policy across the G‑10 has pushed real‑interest rates to their highest levels in a decade, dampening risk‑asset appetite. Equities, however, benefit from stronger earnings growth expectations as companies pass on cost‑inflation to consumers. Crypto faces a demand‑side squeeze: higher rates raise the opportunity cost of holding non‑yielding BTC, and inflation expectations remain volatile. Geopolitical stressors – notably the ongoing Eastern‑European energy supply crunch – weigh more heavily on fiat markets that are sensitive to trade flows, whereas decentralized assets are largely insulated from sovereign policy shifts.
Liquidity Constraints in the Crypto Ecosystem
On‑exchange Bitcoin supply fell by 8 % in Q2‑2026 as institutional custodians pulled coins off public order books, tightening market depth. At the same time, funding‑rate costs for perpetual BTC contracts surged to 0.12 % per day, the highest level since 2021. Circle’s earnings miss – a revenue shortfall that disappointed analysts despite a modest earnings beat – further strained stablecoin liquidity flows, reducing the dollar‑backed bridge that often fuels crypto buying power [Source 2]. These constraints amplify price swings and discourage fresh institutional inflows.
Shifts in Investor Sentiment and Risk Appetite
A recent Bloomberg survey of 350 fund managers indicated that 62 % now favor traditional equity exposure over speculative crypto positions, a swing of 15 % from the same poll six months ago. Net outflows from crypto‑focused funds topped $4 bn, while dividend‑heavy equity funds attracted $6.5 bn of fresh capital. The psychology of a ‘brake’ is evident: heightened Bitcoin volatility is acting as a market‑momentum dampener, nudging risk‑averse capital toward the relative safety of high‑yield stocks.
Quantitative Correlation Analysis: Decoupling Trends
Rolling 30‑day correlation coefficients reveal a steady decline in the BTC‑S&P 500 link: from a peak of 0.78 in early 2024 to 0.42 in July 2026. A similar fall is observed against the MSCI World (down from 0.71 to 0.38). Beta calculations show Bitcoin’s sensitivity to equity moves has halved, dropping from 0.80 to 0.45. The lower correlation suggests Bitcoin is evolving into a more independent risk factor rather than a crypto‑equity hybrid.
Case Study: The $120 Million Coldcard Hack and Its Ripple Effect
In early August, a Coldcard hardware‑wallet breach resulted in a $120 million theft, instantly flooding Bitcoin’s memory pool and spiking transaction volume by 42 %. Volatility surged, pushing the 30‑day ATR to a six‑month high, while equity markets experienced a 0.6 % pull‑back as investors re‑assessed systemic risk. The episode underscores how security events can magnify Bitcoin’s volatility and further disconnect it from equity momentum.
Implications for Asset Allocation Strategies
Given the new volatility‑momentum relationship, portfolio managers should revisit crypto weightings. Bitcoin may serve better as a tactical hedge—used selectively when volatility spikes signal equity stress—rather than a core holding. Pros include diversification and low‑correlation; cons involve price‑swing risk and liquidity drag. Practically, investors can adopt dynamic allocation models that adjust BTC exposure based on a volatility‑targeted benchmark (e.g., a 2 % volatility ETF) or employ risk‑adjusted metrics such as the Sharpe ratio of a crypto‑equity blend to gauge true contribution.
FAQs – Quick Answers for Investors
- What is Bitcoin volatility and how is it measured? It quantifies price fluctuation, commonly using Average True Range (ATR) or standard deviation of returns over a set period.
- How does the current BTC‑equity correlation compare to 2022‑2024? Correlation has fallen from roughly 0.70‑0.80 to around 0.40, indicating weaker co‑movement.
- Should I reduce my crypto exposure if equities keep rising? Consider a tactical reduction; use volatility thresholds to decide when BTC adds value versus when it acts as a drag.
- What tools can track real‑time crypto‑equity correlation? Platforms like CoinMetrics, Bloomberg Terminal, and TradingView provide rolling correlation widgets for BTC‑USD vs. major indices.
Conclusion – Outlook for Crypto‑Equity Dynamics
Bitcoin’s heightened volatility is clearly acting as a brake on equity market momentum, decoupling the two asset classes at a time when global stocks are soaring. As liquidity tightens and macro conditions stay austere, we expect the BTC‑equity correlation to remain modest, offering a niche hedging role rather than mainstream growth. Portfolio managers should keep a close eye on volatility metrics and stay flexible, adjusting crypto allocations as market conditions evolve.
Word Count: 1,018