Written by Kitco Metals August 02, 2017
Questioning a 10% gold silver allocation strategy from when it was born and to where we stand today.
Market Updates and Opinions are provided as a third party analysis and do not necessarily reflect the explicit views of Kitco nor Kitco Metals Inc. The following information below should not be construed as financial advice nor is the author a financial advisor.
By: James Anderson
To understand why the somewhat cliche 10% gold investment allocation mantra may be somewhat misleading today, some historical context is required.
In this 10 minute read, we will especially pay attention to the last half century or so in which fiat currencies (the numeraire in which gold and silver bullion are most often measured against) have been in full expanding usage across the globe (starting in the early 1970s).
HISTORICAL GOLD SILVER INVESTMENT ALLOCATION CONTEXT
Nearly a half century ago, the London Gold Pool price rigging ended (1968). That was essentially the beginning of the end for the fixed $35 oz USD Bretton Woods’ gold price which was set globally following World War II and ultimately helped establish the US dollar then and still the main reserve currency it is today (while lessening its dominance in recent years, about 60% of all currency worldwide is still USD denominated).
In August 1971, President Richard Nixon closed the official central bank gold window which meant nations could no longer exchange US dollars for gold bullion. Remarkably US citizens were still not even allowed to own more than some 5 ounces of gold bullion until full gold ownership freedom was reestablished at the start of 1975.
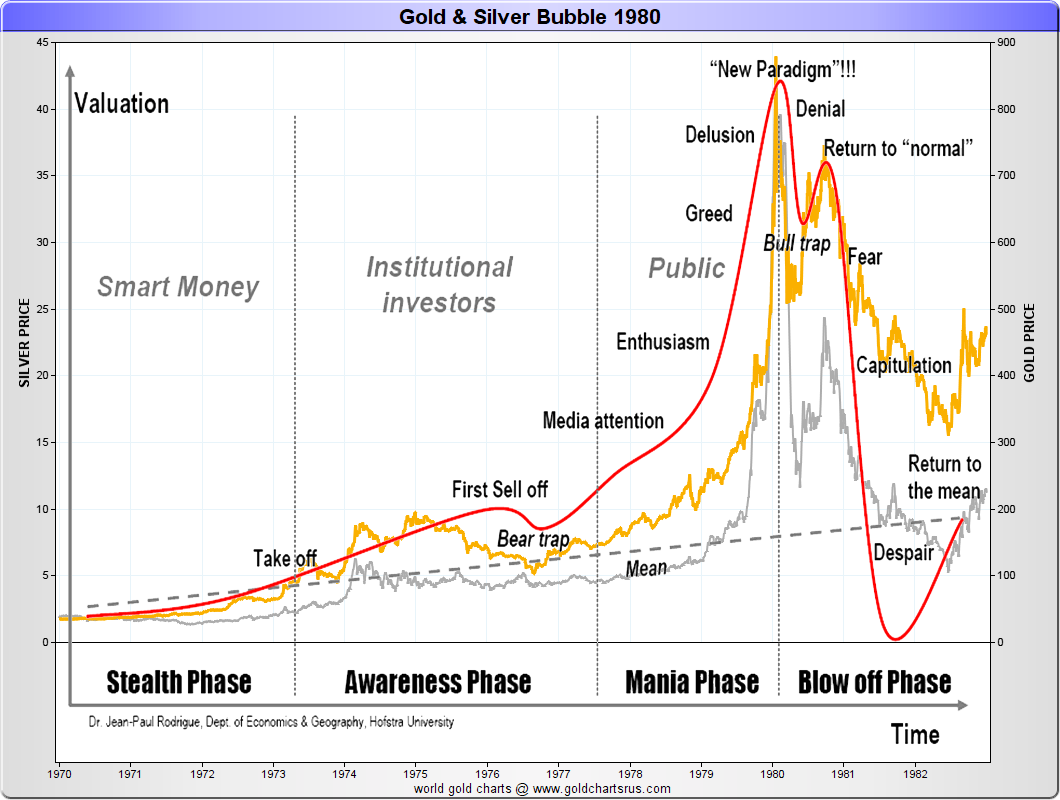
One ounce of gold ultimately performed a more than 20 multiple in US dollar values from a beginning price of about $38 oz USD in 1970 up to January of 1980 when it peaked at just over $850 oz USD.
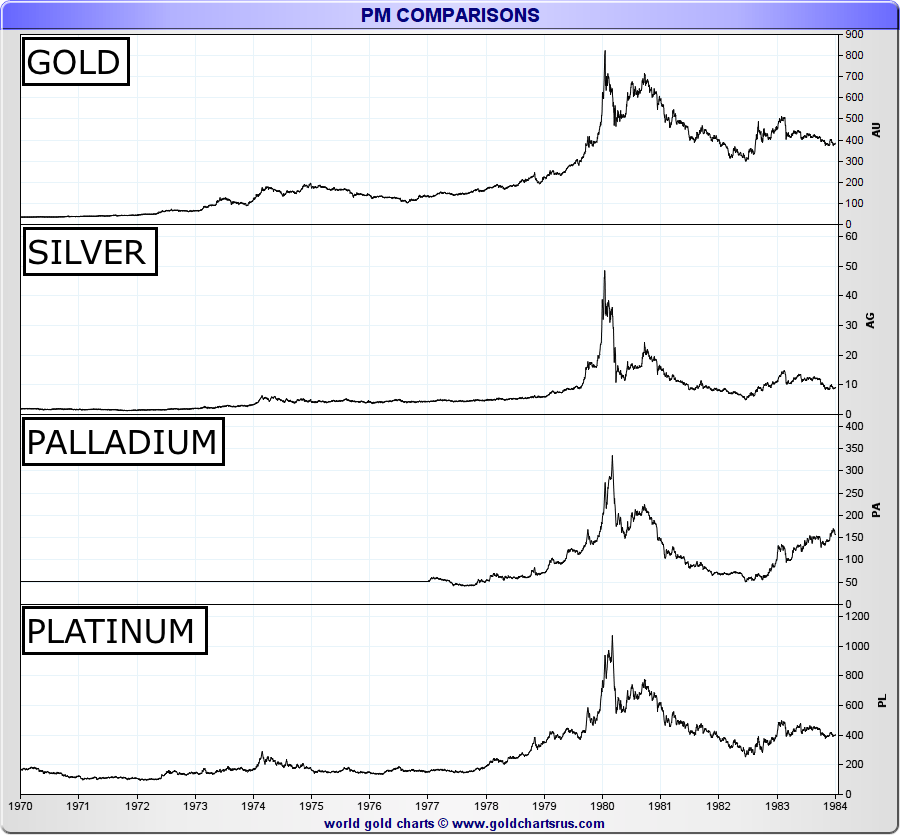
Similar price performances for gold bullion also occurred for platinum bullion, palladium bullion, and especially silver bullion throughout this 1970 – 1980 timeframe. Notice all four precious metal peaks occurred within months of one another in early 1980 (COMEX forced liquidations of silver long contracts likely played a significant role in ending the price run ups for all four precious metals).
Following the 1980 mania in precious metals, it became fairly commonplace for financial experts and advisors to suggest investment allocations of some 5% to 10% of investment portfolios allocated to gold and perhaps silver for diversification and as a hedge against bond, currency, and equity volatility.
This cliche 10% gold allocation advice still prevails today but only amongst a small minority of financial advisors and commentators. Likely in part due to the brutal silver and gold bear markets experienced throughout the 1980s and 1990s whilst simultaneously occurring alongside many strong bond and stock bull markets the world over, this 10% gold allocation mantra all but disappeared only to have arisen thanks in large most part to the 2008 financial crisis and the prevalence of financial internet research now available.
Today high profile and alternative financial experts, like Jim Cramer or Jim Rickards, often say a 10% gold allocation makes sense, yet they may be a little understated in percentage terms. Let’s take a closer look as to why this may be the case.
JEFFREY CHRISTIAN & CPM GROUP ON GOLD SILVER ALLOCATIONS
For over a decade I have worked and invested in the physical precious metals industry. Throughout this timeframe Jeffrey Christian and the CPM Group have consistently produced sound and accurate research and market projections.
When one studies precious metal price discovery mechanisms and the fractionally reserved leverage which commodity exchanges (e.g. COMEX ) use to highly influence precious metal spot prices and therefore ultimately physical bullion prices, the truth is futures derivatives have mainly run the show on bullion price discovery for decade after decade (perhaps the fall of 2008 a one glaring exception to this rule as bullion prices went up whilst their spot prices went down).
Jeffrey Christian is a somewhat controversial figure amongst many long term bullion buyers (mainly due to his explicit citing of the commonality in 100 oz paper derivative to 1 oz bullion leverage used in bullion price discovery mechanisms at a 2010 CFTC hearing, note moment 5:30 here). This fact angers many a bullion buyer as being unjust (including myself at times) but that doesn’t mean Mr. Christian was wrong in citing the virtually unbacked leverage in use in the year 2010, nor for that matter to date.
My experience studying Jeff and CPM Group’s work suggests not to bet against his nor his research firm’s analysis.
Jeff was bearish as we reached interim price highs for silver in the spring of 2011 and goldin the fall of 2011 whilst myself and most precious metal bullion buyers and sellers had little clue we would endure a cyclical bear market for as long and as pronounced as we have had to date.
Good news for bullion longs like myself is that Mr. Christian has recently been on record stating good years are ahead for both silver and gold prices. Given where we stand today perhaps he is not sticking his neck out all too far.
BACKTESTING CLICHE 10% GOLD ALLOCATION SUGGESTIONS
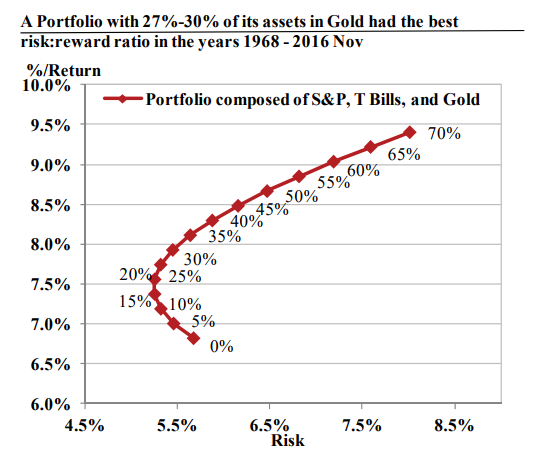
According to Jeff in the early part of the 1980s, there were many seminal gold price studies that showed 5% or 10% of an investment portfolio could have been optimally allocated to gold from 1968 to 1980 to maximize a risk return allocation based on performance.
In late 2016, Jeff and his firm re-ran those numbers in a backtest from about 1968 to late 2016. What they found was if you took a portfolio of 50% S&P and 50% T-bills and you added gold to it in 5% increments, the optimal gold allocation was actually about 27% to 30% gold depending on whether you used T-bills or T-bonds respectively.
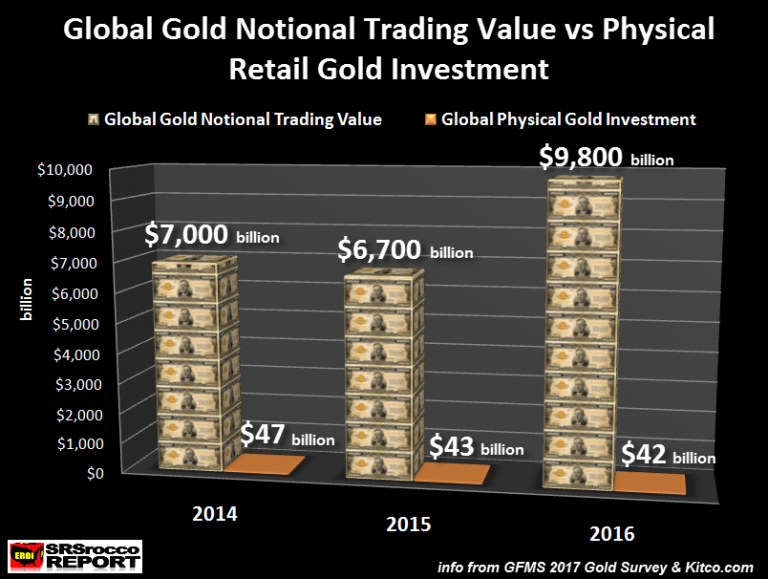
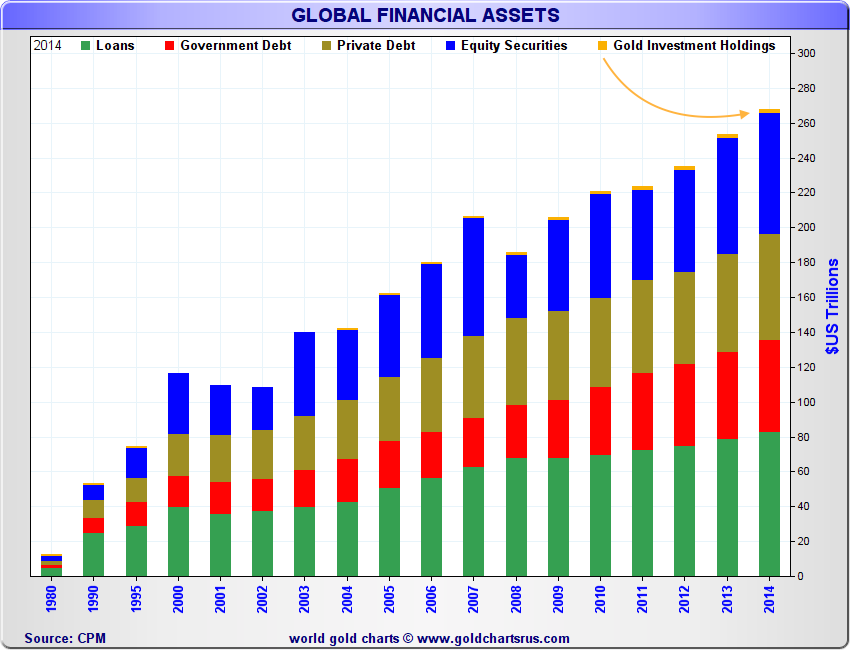
Do take note, this 27% to 30% gold allocation does not take real estate investing into account (a study like that would be prohibitively more complex). The study strictly referred to bonds (now in total an over $100 trillion USD market worldwide e.g. government, corporate, etc.) and equity or stock markets (an over $50 trillion USD market worldwide) which are and have been easily estimated at more than ten times the size of all the physical silver and gold above ground and much less paltry investment allocations to each respective precious metal currently.
For example see the explosive growth in paper asset values to gold investment holdings since 1980 in the following chart.
It is also important to note that this recent CPM Group study on gold allocation spans almost the entire full fiat currency era in which all nations states have and continue to only issue paper and digital currencies backed by the full faith, credit, and taxation powers of their respective nation states.
Global physical gold and silver inventories and supplies expand slowly a sound money systems tend to be deflationary by their very nature. The same cannot be said for many fiat currency numeraires in which silver and gold are mostly measured (see the M2 chart below for many of their growth trends).
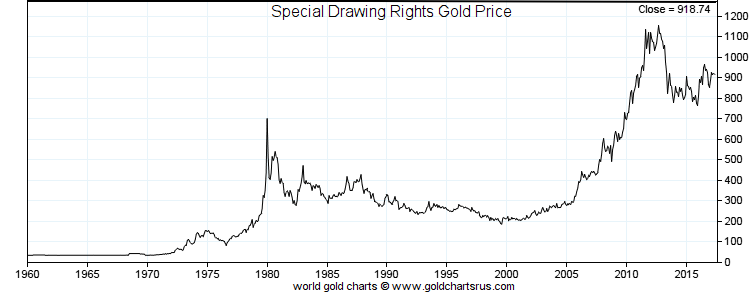
IMF SDRs are not excluded either, since 1973 SDRs have simply been indexed or backed by a fiat currency mix of unstable benchmarks like US dollars, yen, pounds, and more recently euros and yuan.
All SDRs have done since 1973, is lose some 95% of their purchasing to gold bullion and about 92% of its value to silver bullion. This trend will most likely not change unless the underlying structure of IMF Special Drawing Rights themselves are changed to include some form of bona fide physical bullion backing aside from its current 5 fiat currency indexing.
So long as we remain under a full fiat currency monetary system, I find it hard believing no physical silver bullion or gold bullion ownership makes prudent sense on a go forward basis.
Maybe we should reexamine from where and when the cliche 10% gold allocation suggestion was born and put it to the test in terms of today’s bond and equity market valuations? Which asset classes seem most overpriced?
Perhaps it is prudent to buy and own what is most undervalued at the moment.

Contrary to naysayers, most bullion buyers are college educated, yet they are self-taught as little to no universities teach anything about bullion nor why 21st Century central banks increasingly own and buy more gold bullion reserves year in, year out.
The vast majority of gold and silver bullion buyers don’t buy bullion because they think the world’s going to end. Most simply buy bullion because they want to maintain their purchasing power over the long term. Having a portion of one’s wealth denominated in physical silver and or gold bullion is likely more stable than having an undiversified investment portfolio which often can be subject to severe currency valuation volatility, potential bond bear markets, and eventual stock bear markets which can wreak havoc on one’s investment portfolio if not properly diversified ahead of time.
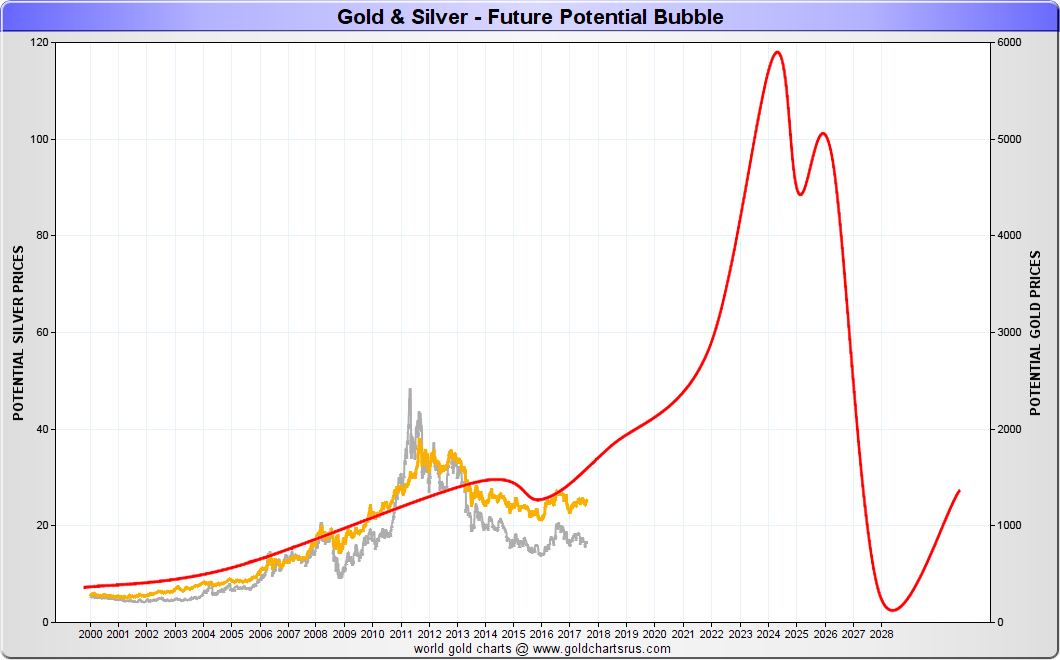
I personally expect another mania in precious metal prices to ensue as the years progress, somewhat similar but far larger in scope than the last late 1970s version.
Perhaps now is the time to begin reallocating some capital from equities and other paper assets back into physical precious metals.
Low premium silver bars or silver coins are often a great choice for those just getting started with bullion buying. The downside on their current prices long term appear to be somewhat limited, and the upside potential for gold bullion and especially silver bullion looks to be attractive at these current price and bullion product premium levels.
Online.Kitco.com is an industry leading website used to sell and buy silver, gold, platinum, palladium, and rhodium bullion products. Currently celebrating our 40th year serving bullion investors worldwide. We are an industry leader serving both as an agnostic precious metals news and data source as well as a physical bullion dealer worldwide.
Market Updates and Opinions are provided as a third party analysis and do not necessarily reflect the explicit views of Kitco nor Kitco Metals Inc. This information above should not be construed as financial advice.